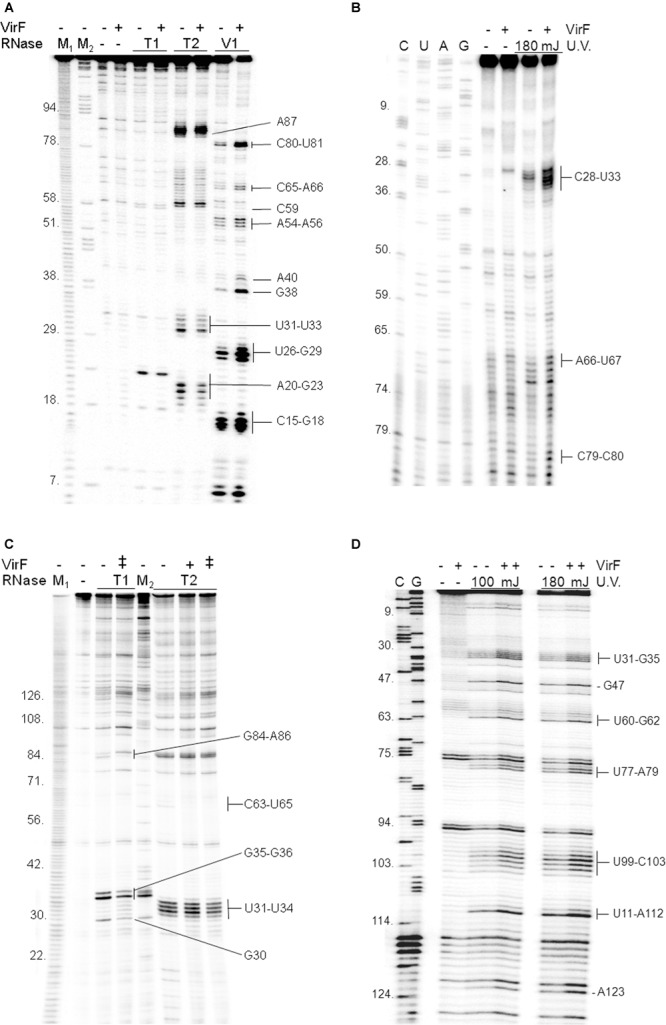
FIGURE 3.

Localization of VirF binding sites on RnaG120 and icsA mRNA. RNA footprints were carried out, as described in Section “Materials and Methods,” on RnaG120 (A) and on the leader region (370 nt) of icsA mRNA (C). RNases digestions were performed in the absence (–) or in the presence of 250 nM (+) of VirF in (A) and 250 nM (+) and 500 nM (++) of VirF in (C). M1 and M2 represent OH- and ΔT1 ladders, respectively. U.V. cross-linking assays on RnaG120 (B) and icsA mRNA (D) were carried out without protein (–) and with 250 nM of VirF. Lanes C, U, A, and G correspond to sequencing reactions.
