
FIGURE 1.
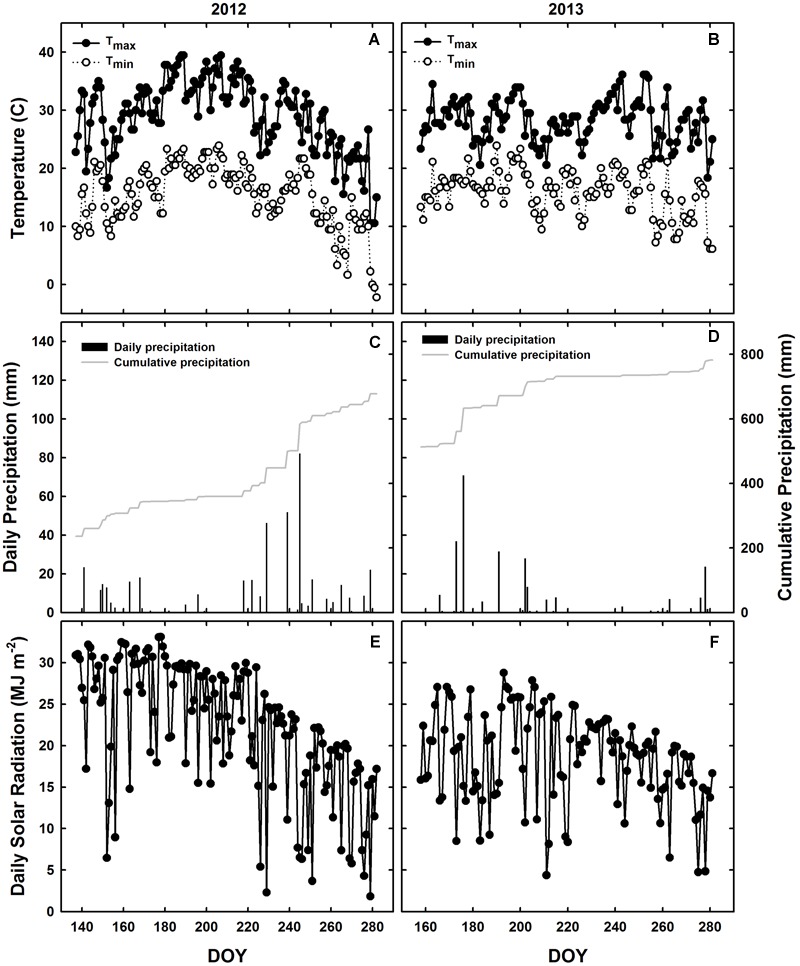
Meteorological conditions during the 2012 and 2013 growing seasons in Champaign, IL, USA. Daily observations from 2012 (A,C,E) and 2013 (B,D,F) are indicated for maximum (black circles) and minimum (white circles) temperatures (A,B), daily precipitation during the growing season (black bars) and cumulative annual precipitation (gray line; C,D), and incident solar radiation (E,F).