
FIGURE 6.
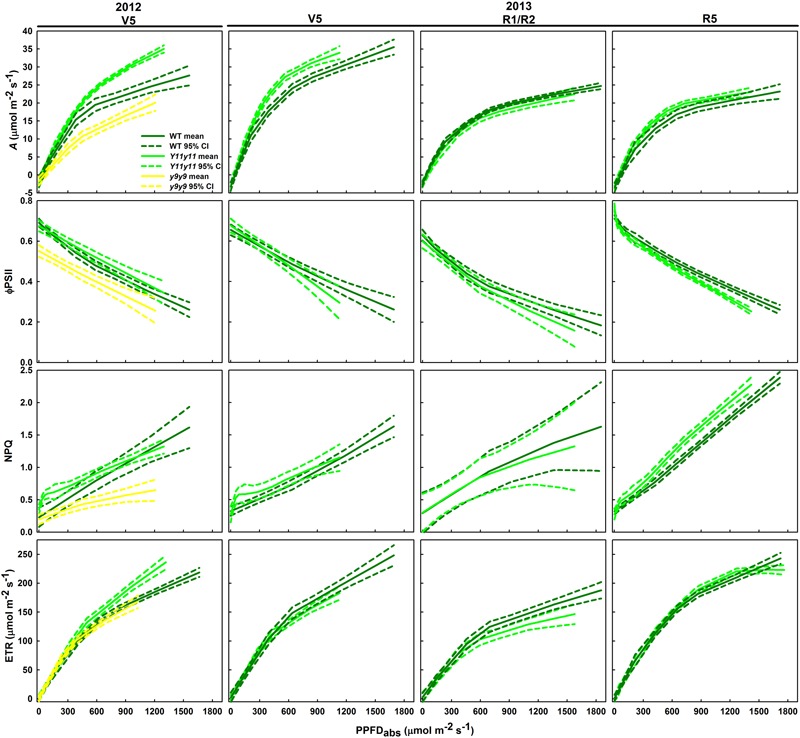
Light response curves from various developmental stages across two growing seasons in sun leaves. Aleaf, ϕPSII, NPQ, and ETR as a function of absorbed PPFD are shown in sun leaves during V5 of 2012 and during V5, R1/R2, and R5 of 2013. Means (solid line) and 90% confidence intervals (dashed lines) are indicated for each genotype (n = 3).