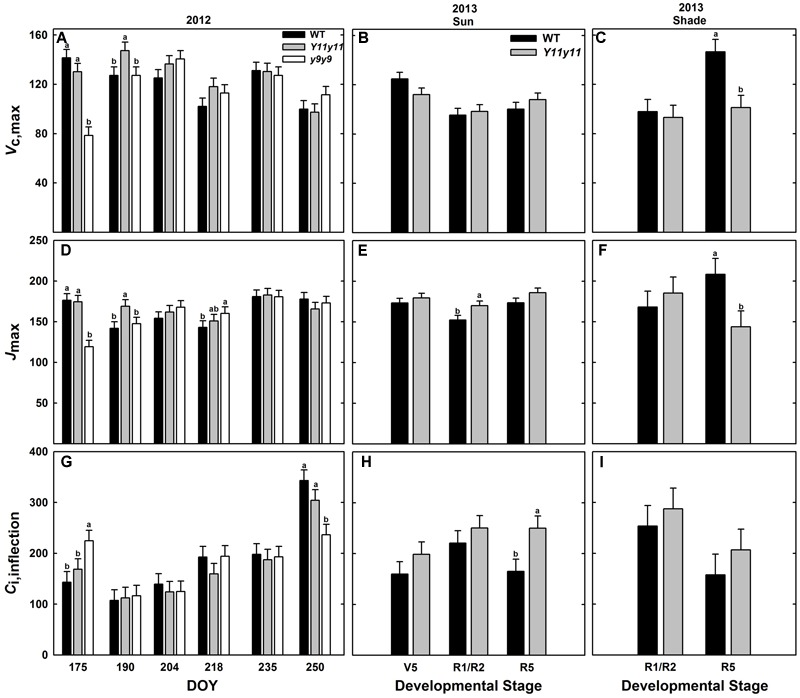
FIGURE 7.

Parameters from photosynthetic CO2 response (A/Ci) curves across two growing seasons. Vc,max (A–C), Jmax (D–F), and Ci,inflection (G–I) from 2012 sun leaves (A,D,G), 2013 sun leaves (B,E,H), and 2013 shade leaves (C,F,I) are reported for WT (black), Y11y11 (gray), and y9y9 (white) soybean. Error bars represent standard errors (n = 3). Letters indicate significant differences within DOY or developmental stage (α = 0.1) when present.
