Figure 3.
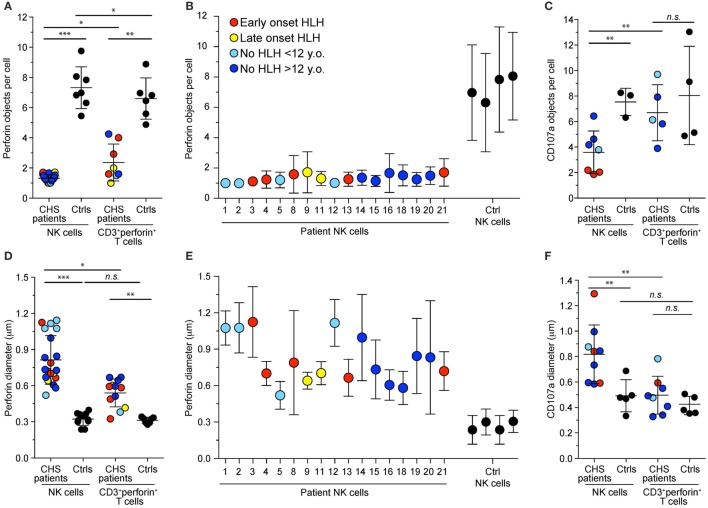
Cytotoxic granule numbers and size in NK and T cells of Chediak–Higashi syndrome (CHS) patients. Freshly isolated, blood-derived NK cells and CD3+perforin+ T cells were labeled intracellularly with antibodies to perforin and CD107a. Plots depict the (A–C) number and (D–E) diameter of (A,B,D,E) perforin or (C,F) CD107a granules per NK cell or cytotoxic T lymphocyte from individual CHS patients and healthy controls. Values represent the average of multiple cells in each individual with mean and SD indicated for (A,C,D,F) cumulated individuals or for (B,E) each patient and control individually. Symbols represent mean values and bars SD. With respect to perforin stainings, an average of 69 (range 4–510) CHS patient and 176 (range 35–536) control NK cells and 7 (range 2–14) CHS patient and 144 (range 35–309) control T cells and ere quantified. The patients are color-coded according to whether they presented with early-onset hemophagocytic lymphohistiocytosis (HLH) (<2 years), late-onset HLH (>2 years), or no HLH diagnosis, as indicated. Non-parametric Mann–Whitney U tests were performed.

