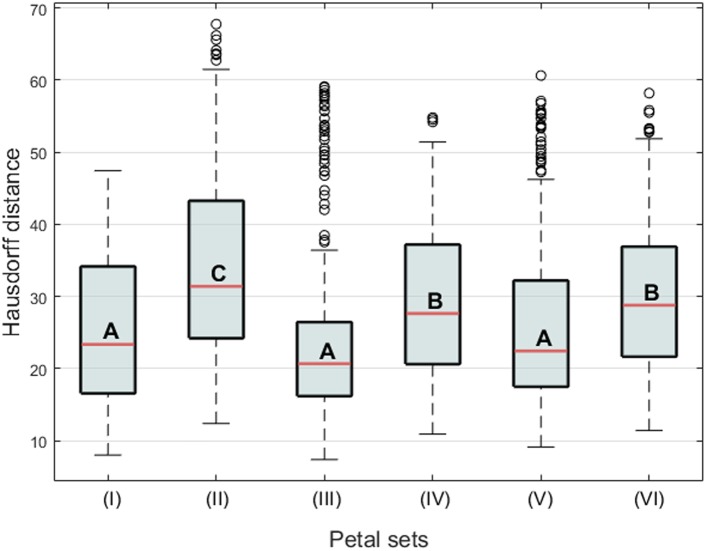
FIGURE 10.
Boxplot of the Hausdorff distances between the petal sets. The letters A, B, and C indicate the groups of the petals. The Roman numerals indicate the comparison of two-petal set pairs, (I) the dorsal and ventral petals of actinomorphic plants, (II) the dorsal and ventral petals of zygomorphic plants, (III) the ventral petals of actinomorphic and zygomorphic plants, (IV) the dorsal petals of actinomorphic and zygomorphic plants, (V) the dorsal petals of actinomorphic plants and the ventral petals of zygomorphic plants, and (VI) the ventral petals of actinomorphic plants and the dorsal petals of zygomorphic plants.

