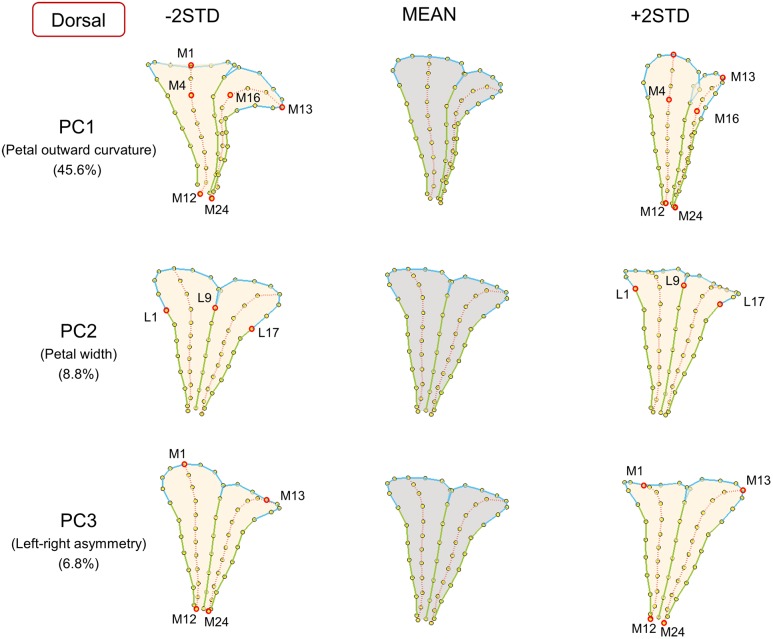
FIGURE 3.
The major shape variations of the dorsal petals. The PC1, PC2, and PC3 scores accounted for 45.6, 8.8, and 6.8% of the total shape variation of dorsal petals, respectively. Yellow dots represent landmarks. Red circles represent labeled landmarks. Cyan, green, and red lines represent the lobe contours, tube boundaries, and petal midribs, respectively. The petal forms with mean PC values are illustrated in gray; the petal forms with PC values of mean ± 2 standard deviations are illustrated in beige.

