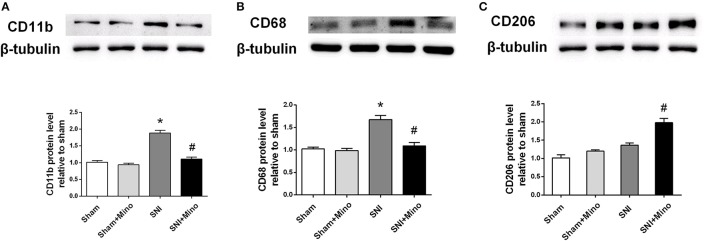
Figure 3.
Western blot results of the prefrontal cortex. (A) A representative blot and quantitative analysis of CD11b in the prefrontal cortex. (B) A representative blot and quantitative analysis of CD68 in the prefrontal cortex. (C) A representative blot and quantitative analysis of CD206 in the prefrontal cortex. β-tubulin was included as control. The data are expressed as the mean ± SEM of 4 rats in each group. *P < 0.05 compared to the sham group, #P < 0.05 compared to the SNI group.

