Figure 4.

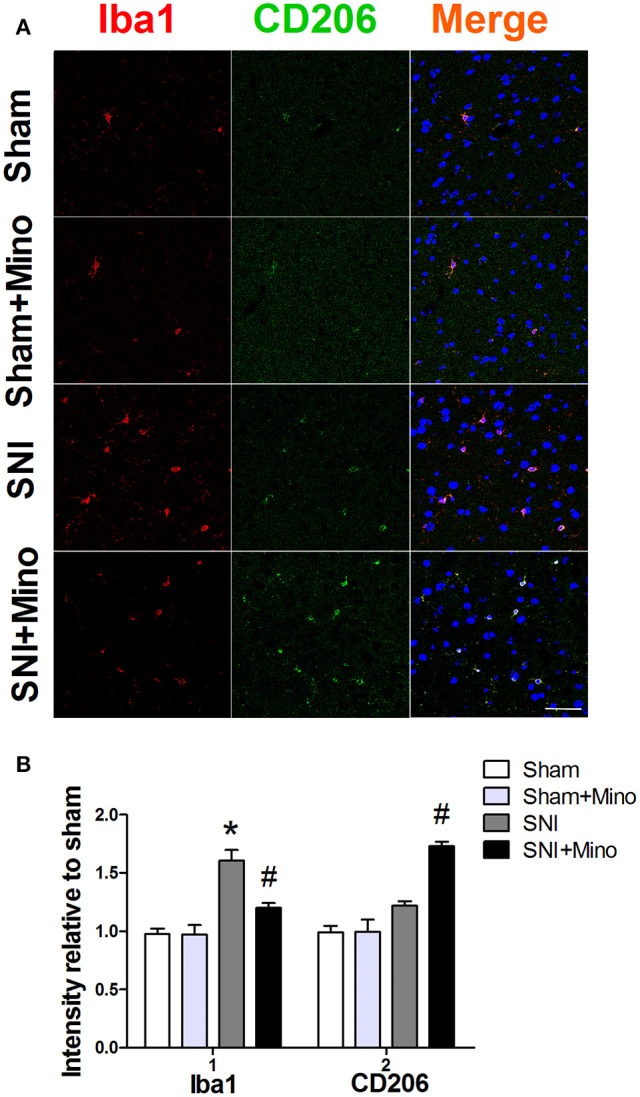
Double-immunofluorescence staining to detect co-localization of Iba1 and CD206 in the prefrontal cortex on day 14 post-SNI. (A) Representative images of Iba1 (red) and CD206 (green) in the prefrontal cortex. (Scale bar = 50 μm). (B) Quantification of Iba1 and CD206 fluorescence in the prefrontal cortex. The data are expressed as the mean ± SEM of 4 rats in each group. *P < 0.05 compared to the Sham group, #P < 0.05 compared to the SNI group. DAPI staining is shown in blue.
