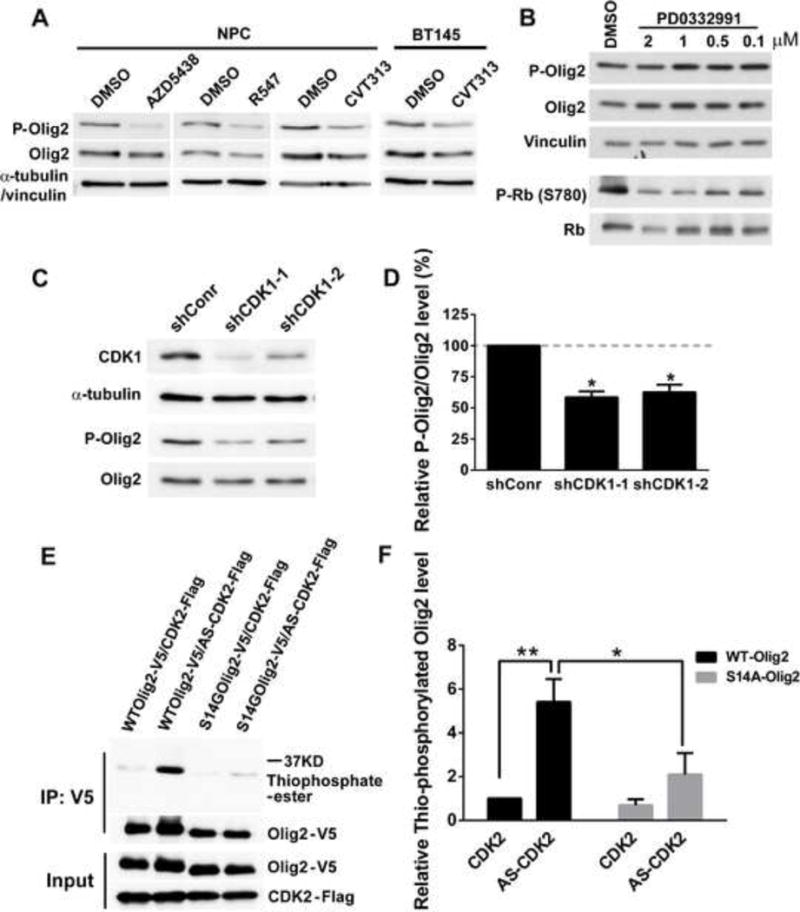
Figure 3. S14 of Olig2 is phosphorylated by CDK1/2.

(A) Mouse NPCs and BT145 human glioma cells treated with CDK1/2 inhibitors show a decrease in P-Olig2 level. AZD5438, CDK1, 2 and 9 inhibitor; R547, CDK1, 2 and 4 inhibitor; CVT313, CDK1 and 2 inhibitor. P-Olig2 and Olig2 levels were examined 4 hr after AZD5438 and R547 treatment or 24 hr after CVT313 treatment in NPCs and 3 hr after CVT313 treatment in BT145 cells. 10 μm AZD5438, 5 μm R547, 10 μM of CVT313 were used. (B) Mouse NPCs treated with CDK4/6 inhibitor, PD0332991, show no obvious change on P-Olig2 level. P-Olig2 and Olig2 levels were examined 4 hr after PD0332991 treatment. (C) Genetic validation of CDK1/2 inhibitor data. Immunoblot assay shows that knock-down of CDK1 in CDK2-knockout NPCs decreases P-Olig2 level. CDK1 was acutely knocked down in CDK2-knockout NPCs by introducing AAV that expresses shRNA targeting mCDK1. Cells transduced with AAV that expresses non-target shRNA served as a control (shConr). The P-Olig2 and Olig2 levels were examined at 48 hr post viral transduction. (D) Quantification of knock-down data. Relative P-Olig2/Olig2 levels were quantified and compared between knockdown group and control group. Data are analyzed by t-test and are represented as mean ± SEM. *p<0.05; n=3. (E) An analog-sensitive kinase assay shows that CDK2 phosphorylates Olig2 at S14 site. (F) Quantification of analog-sensitive kinase assays. Thiophosphorylated Olig2 levels were quantified, normalized to total Olig2, and then compared between different groups. Data were analyzed by two-way ANOVA with Sidak posttest and are represented as mean ± SEM. *p<0.05, **p<0.01; n=4.
