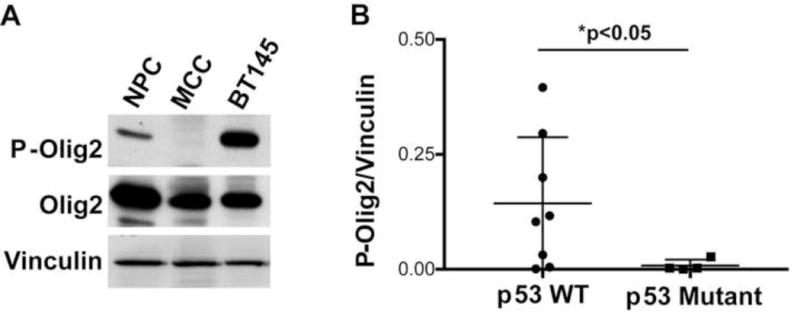
Figure 5. Analysis P-Olig2 levels in a panel of gliomas cells with either wild-type p53 or mutant p53.

(A) Immunoblot of P-Olig2 in cycling neural progenitor cells (NPC), adult mouse corpus callosum (MCC) and low passage human glioma cells (BT145 line). (B) Glioma cell lines with intact p53 have significantly higher level of P-Olig2 than p53-mutant glioma cells. The relative P-Olig2/Vinculin levels were analyzed and compared in different glioma cell lines. Data were analyzed by Mann-Whitney test and represented as mean + SEM. n=8 p53 wild-type glioma cells lines (filled circles) and n=4 p53-mutant cell lines (filled boxes). For frame of reference, the P-Olig2/vinculin ratio of cycling mouse neural progenitor cells (open circle) was set at 1.0.
