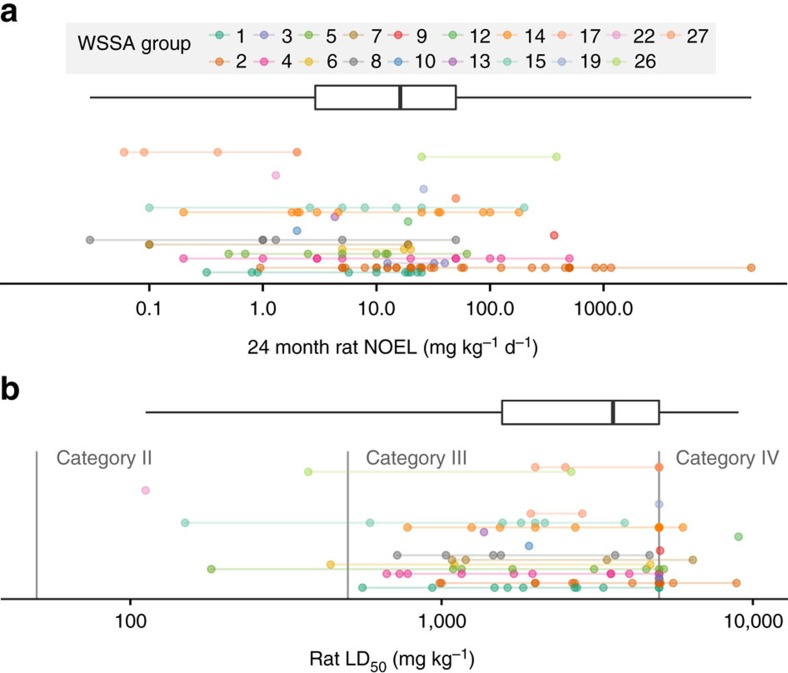
Figure 2. Toxicity of herbicides used between 1990 and 2015 in the United States.
Chronic toxicity (a) represented by 24-month oral rat no observable effect level (NOEL); acute toxicity (b) represented by oral rat LD50. Toxicity is presented on a log10 scale. For boxplots, bold vertical line represents median toxicity value, box encloses the inter-quartile range, and lines extend from minimum to maximum values. Each point represents a unique herbicide active ingredient, colour coded by WSSA site of action group number. Acute toxicity categories are those defined by US EPA.

