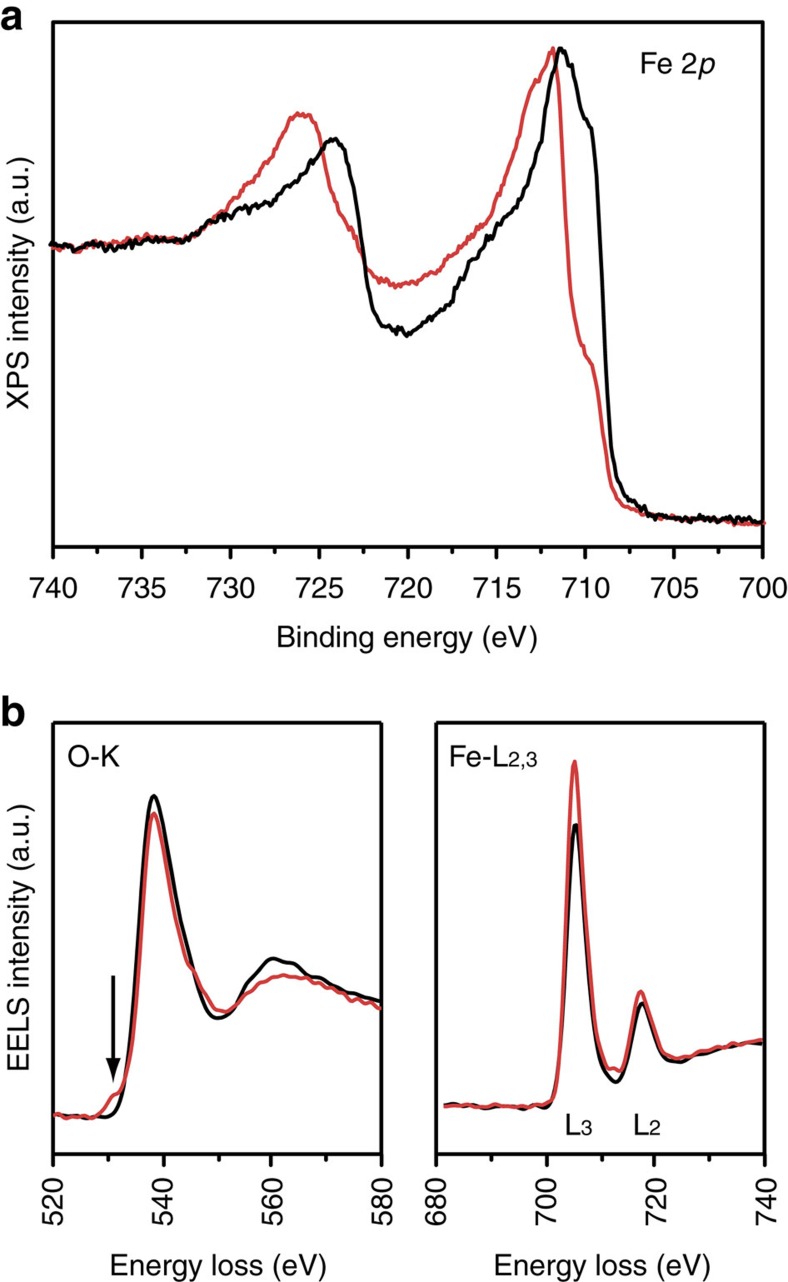
Figure 3. XPS and EELS analysis of LiFePO4 before and after light exposure.
(a) Fe 2p XPS results of the FTO–LFP–dye film before (black line) and after (red line) light exposure. The data are shown after normalization and (b) EELS spectra of oxygen K edge and iron L2,3 edge before (black) and after (red) light exposure.

