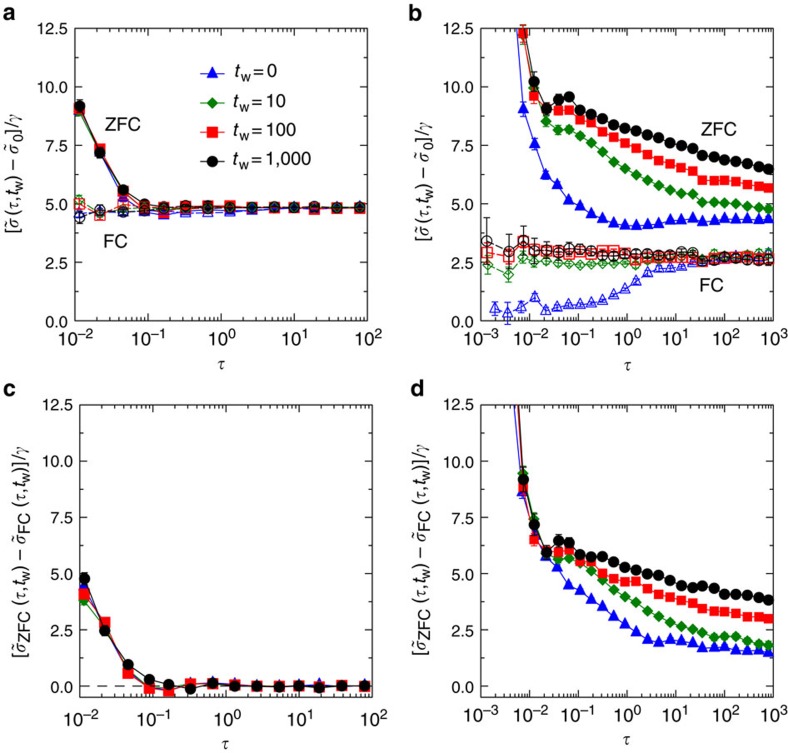
Figure 2. Relaxation of shear stress.
Relaxations of the rescaled ZFC shear stress  (filled symbols) and the rescaled FC shear stress
  (open symbols) show different behaviours at (a)
  =0.670 and (b)
  =0.688, corresponding to the pink plus and cross in Fig. 1, respectively (the Gardner transition density
  G=0.684(1) (ref. 34)). We show results for several different waiting time tw, under an instantaneous increment of shear strain γ=10−3. Data are averaged over many realizations of compressed glasses obtained from a single equilibrated sample at
  g=0.643 with N=1,000 particles. Here the rescaled remanent stress
  is measured in the ZFC protocol at
  , after the longest waiting time tw=1,000 and before the shear strain is applied. The difference
  quickly vanishes and does not show significant tw dependence at (c)
  =0.670, while it decays much slower and shows a strong tw-dependent ageing effect at (d)
  =0.688. Note that by definition,
  is a one variable function, but we plot it here as
  to compare it with
  . The pressure p is independent of time and protocol, in both cases (see Supplementary Fig. 11). The error bars denote the s.e.m.

