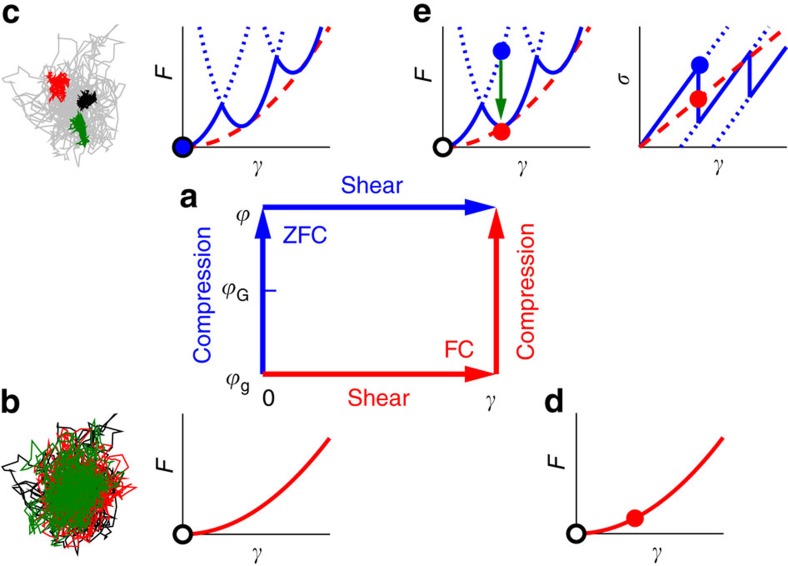
Figure 4. Illustration of protocols.
We show the evolution of the free-energy landscape and the state point ( , γ) under compression and shear. (a) In the ZFC protocol, the system is first compressed and then sheared, while the order is reversed in the FC protocol. (b) State point (
 g,0): the schematic free-energy F as a function of the strain γ at the initial density
  =
= g before compression. We assume that the initial state point (black open circle) is located at the minimum of the parabola. To show an example of the real-space particle caging, we also plot three independent trajectories of the same tagged particle in the same two-dimensional sample (see Supplementary Note 5). (c) State point (
 , 0): if the system is compressed first to
  (above the Gardner transition density
  G), the free-energy basin (red dashed line) splits into many subbasins (blue line): the state point (blue solid circle) becomes trapped in one of the subbasins. The dotted blue lines represent the metastable region of the subbasins. The split of free-energy basin corresponds to the split of cage in the real space (as an example, see the independent trajectories representing three split cages). (d) State point (
 g, γ): on the other hand, if the system is sheared first, the state point (red solid circle) is forced to climb up the parabola of the basin. (e) State point (
 , γ): after both shear and compression, the state point can be located at different points in the same free-energy landscape, depending on the order of the compression and shear. In the ZFC case, the state point (blue solid circle) is forced to climb up the subbasin where it is trapped, while it can remain at lower free-energy state in the FC protocol (red solid circle). Because subbasins are metastable (dotted blue line), MPEs occur with increasing γ in a quasistatic shear, and slow relaxation occurs for a fixed γ (green arrow). The shear stress σ is determined by
  (right panel), and the shear modulus by
  . The stress–strain curves show that for
  >
> G, μZFC (slope of blue line) is larger than μFC (slope of dashed red line).

