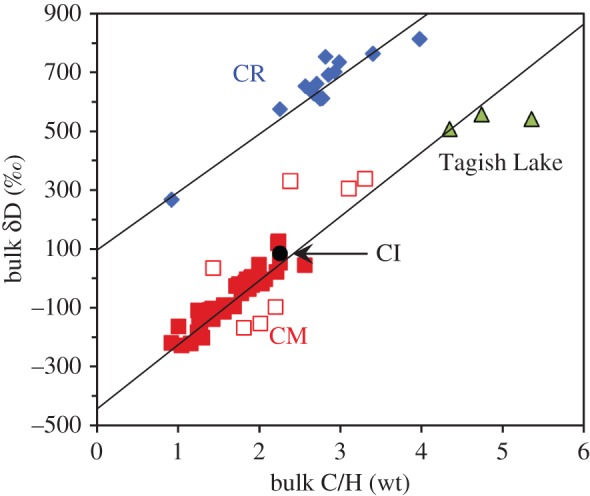
Figure 4.

The bulk H isotopic compositions versus the bulk C/H ratios of CI, CM, CR and Tagish Lake carbonaceous chondrites (after [23]). The linear arrays displayed by the CM and CR chondrites reflect mixing between relatively D-poor water/OH and D-rich organic matter (δD ≈ 3500‰). The y-axis intercepts of the best-fit lines to the CM and CR trends give their water/OH compositions. The open red squares are CM chondrites that were not used in the fit for various reasons (see [23]). (Online version in colour.)
