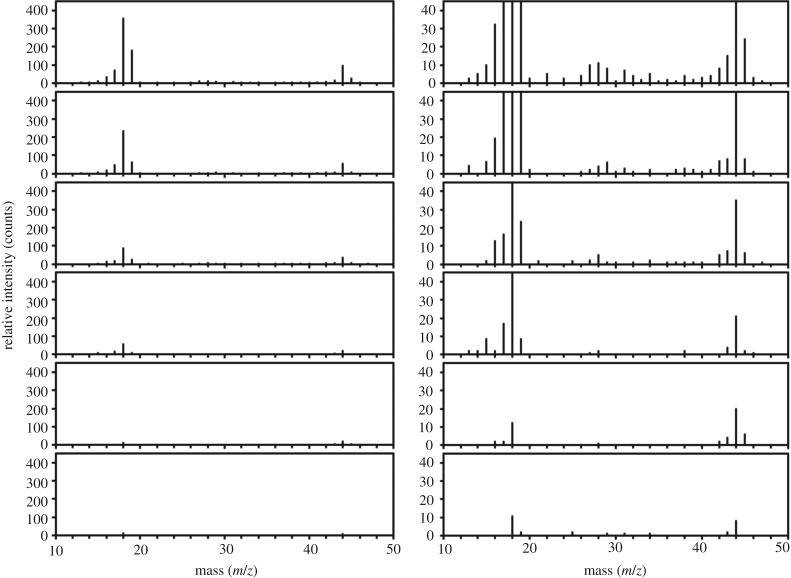
Figure 1.
Plots of mass spectra taken by Ptolemy at the Abydos landing site. Each plot shows on the x-axis the mass of the species measured (or, more correctly, the mass/charge ratio, i.e. m/z) versus the relative intensity of the signal at each mass (y-axis). Successive plots from top to bottom were taken at progressively longer intervals after Philae came to rest at Abydos. The plots on the left and right in each case are the same, but with a 10-fold difference in the intensity scale. What can be observed here is that even by the end of the monitoring period there are still peaks at m/z 18 (H2O+) and 44 (CO2+), the measured number of counts being way above anything expected as a background.

