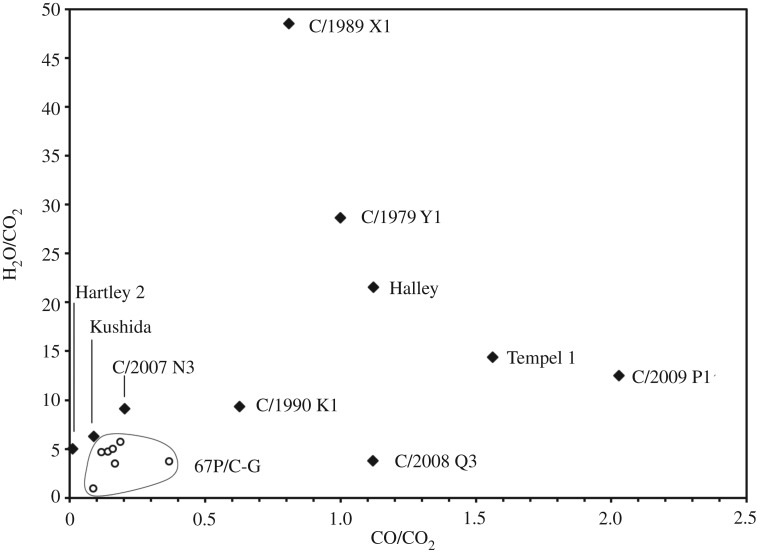
Figure 2.
Plot of H2O/CO2 ratios of comets versus CO/CO2 (data taken from [38]). There are a number of additional measurements that have yielded H2O/CO2 ratios (spanning a range of 3.5–14.5) but no accompanying CO/CO2. Filled diamonds are spectroscopic measurements made by remote, telescopic means. The circles represent the equivalent ratios measured at the nucleus of 67P by Ptolemy (data from [34]; note that there are, in fact, seven points plotted—two of the Abydos points plot on top of each other, while the point that shows the highest CO/CO2 ratio is that measured at Agilkia). The far more extensive datasets acquired by ROSINA are not included since these are influenced by specific regional-scale processes (which are, in turn, the result of daily and seasonal effects) and are complicated by the orientation of the spacecraft with respect to the nucleus at the time the measurements were made. Notwithstanding this, on the basis of data taken from the coma at about 3.5 AU from the Sun, H2O/CO2 is typically in the range 5–10 with CO/CO2 of 1–3 [39]. In extreme cases, H2O/CO2 drops to about 0.01.

