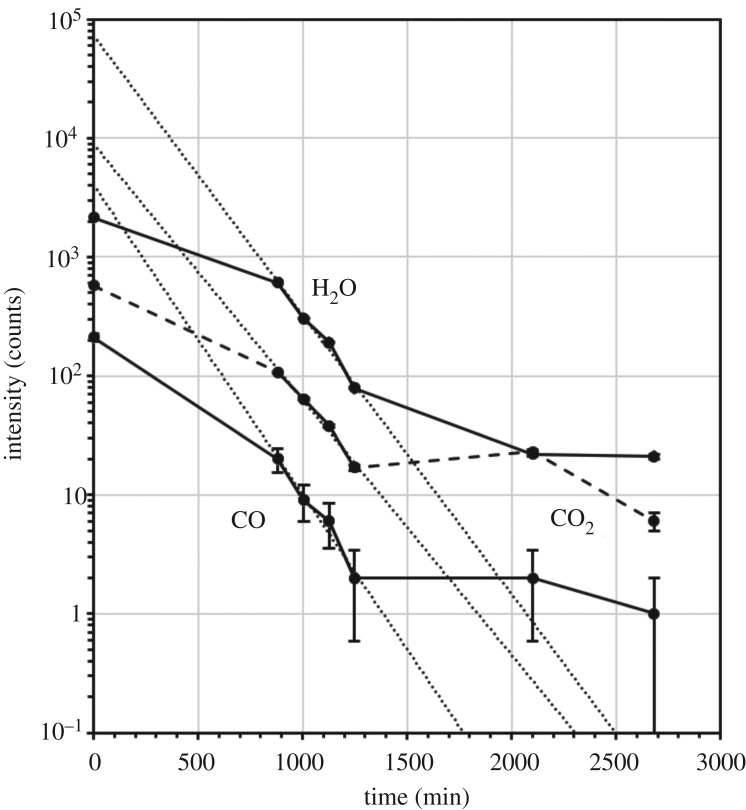
Figure 3.
Plot of the intensities of mass spectral peaks due to H2O, CO2 and CO showing how these varied with time after the arrival of Philae at the surface of 67P. The first data point in each case is from the experiments conducted at Agilkia; the remainder are from the long-term monitoring campaign at Abydos. Best-fit lines though data collected between 881 and 1248 min (four consecutive points in each case) are shown as the dotted lines. Note that the species labelled as CO2 and CO are not corrected for the effects of cracking of CO2+ (m/z 44) to CO+ (m/z 28). This has not been done herein because the exact details of corrections like this are not yet certain and will require further work. However, it is a fact that without correction the values recorded for CO are upper limits. Error bars are 1 s.d. (i.e. the noise associated with ion counting).

