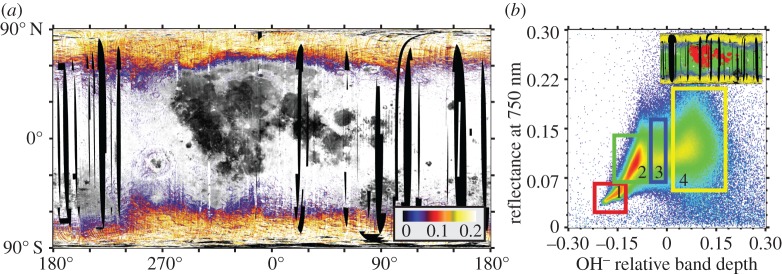
Figure 1.
(a) Global distribution of OH− relative band depth as measured by the M3 instrument. Data from optical periods 1b, 2a and 2c1 are included. OH− relative band depth is depicted as a colour ramp overlain on a 750 nm reflectance basemap. Regions with near-zero relative band depths have been made transparent to show the relationship of absorption band strength to major terrains. Map projection is simple cylindrical. (b) Density plot of the global relationship between 750 nm reflectance and OH− relative band depth. At least two trends can be discerned—the equatorial trend, which exhibits a roughly linear relationship between reflectance and relative band depth, ranging from the mare regions (box 1, red on inset map) to highland regions (box 2, green on inset map), and a high-latitude trend, primarily encompassing higher reflectance terrains. It is only at latitudes poleward of about approximately 60° that absorption relative band depths become consistently positive on a regional scale (box 4, yellow on inset map), although there are some small local anomalies showing positive OH− relative band depths in both the mare and the highlands.

