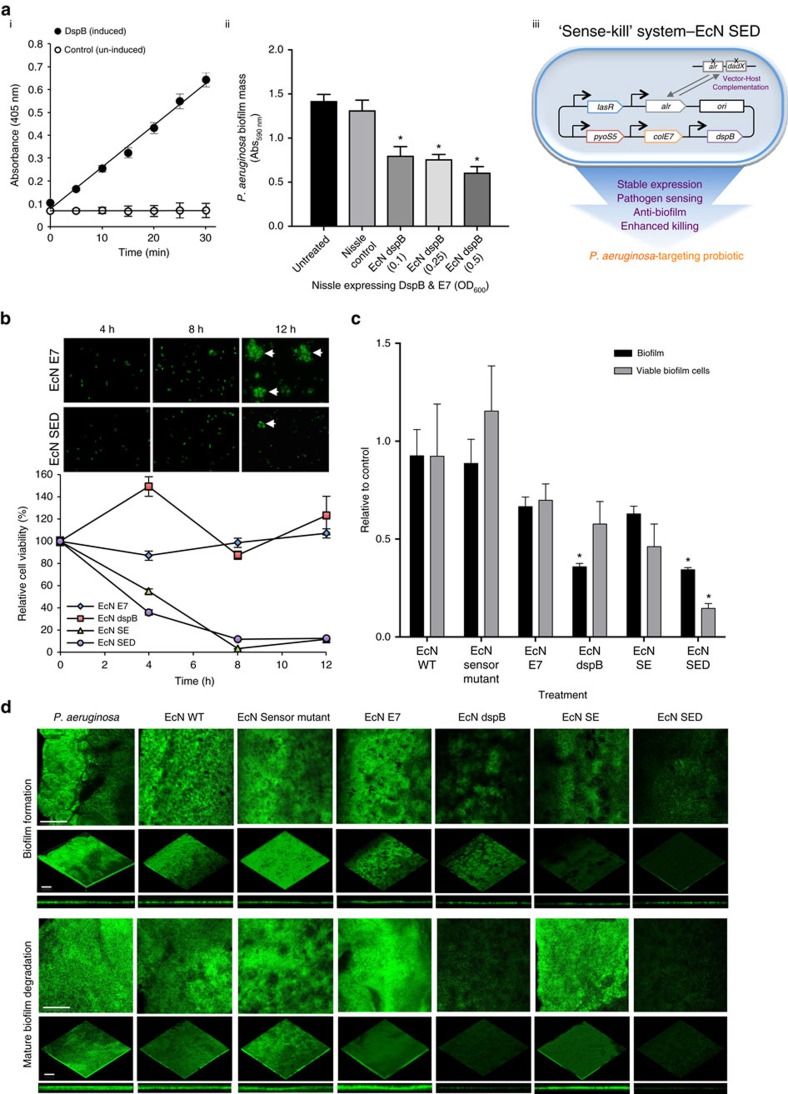
Figure 2. In vitro functional assays of the engineered probiotic strain.
(a) (i) Glycosyl hydrolase activity of DspB with 4-nitrophenyl-N-acetyl-β-D-glucosaminide as substrate. The optical density at 405 nm (OD405 nm) is proportional to the amount of 4-nitrophenolate released in the reaction. (ii) Anti-biofilm activity of DspB expressed by the varying number of EcN cells (OD600 nm) against mature P. aeruginosa biofilm. EcN cells expressing DspB & E7 under quorum sensor are termed ‘EcN dspB'; the change in biofilm biomass was quantified by crystal violet staining. ‘Untreated' refers to mature P. aeruginosa biofilm. The Nissle control is P. aeruginosa biofilm treated with wild-type EcN cells. The mean and s.e.m. (error bars) from three experiments are shown. * indicates statistical significance (Student t-test, P<0.05) compared to Untreated and to the Nissle control. (iii) Schematic representation of engineered EcN with the new ‘Sense-kill' killing circuit, EcN SED (S5 pyocin, E7 lysis protein and Dispersin B), in the auxotrophic vector-host complementation system to produce an optimized P. aeruginosa-targeting probiotic. (b) P. aeruginosa viability at the indicated time points of co-culture with EcN SED in comparison with lysis control (E7), EcN dspB and EcN expressing S5 & E7 (EcN SE). The data are presented as relative cell survival of P. aeruginosa cells in each treatment group compared to the P. aeruginosa control group at each time point. Small aliquots of each co-culture were taken at the indicated time points for microscopic observation. The arrow indicates formation of microcolonies. (c) Anti-biofilm activity was measured by quantifying biofilm mass (by crystal violet staining) and viable biofilm cells (by cell viability counting) after treating mature biofilm with engineered EcN cells for 6 h. The results are shown relative to the P. aeruginosa control groups. The mean and s.e.m. (error bars) from three experiments are shown. * indicates statistical significance at an alpha value of <0.05 by one-way ANOVA with the Bonferroni multiple comparisons test. (d) P. aeruginosa biofilm containing the GFP expression vector was grown on 8-well chambered glass slides for 48 h; the biofilm was subsequently treated with the engineered EcN for 6 h and visualized by confocal laser scanning microscopy (CLSM). P. aeruginosa was co-cultured with engineered EcN for 20 h to evaluate its effect on biofilm formation. Images were reconstructed from biofilm Z-stacks (30-μm thickness) using ImageJ. The scale bars represent 100 μm.

