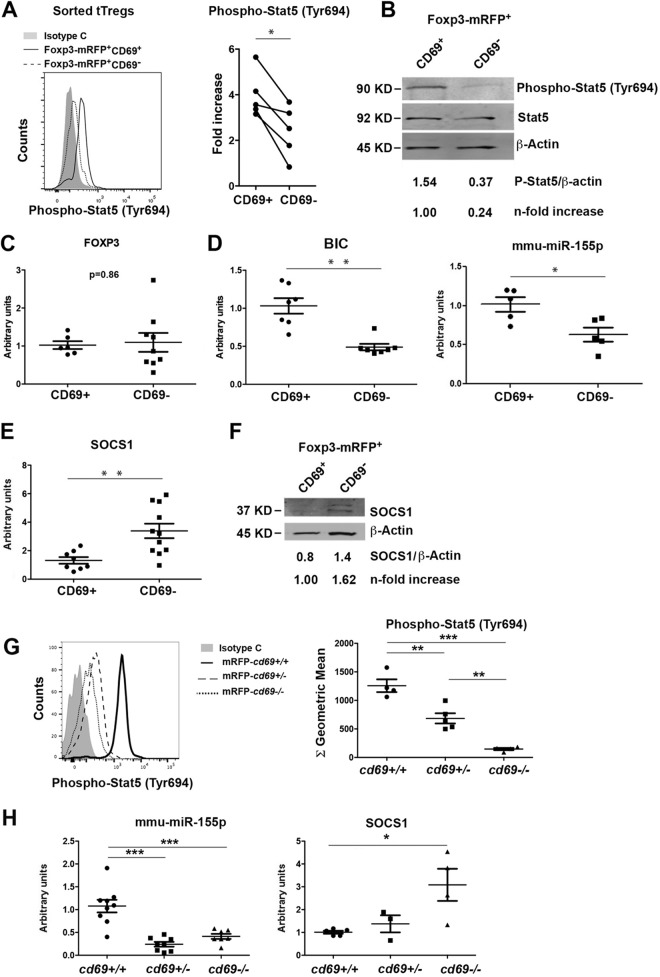
FIG 4.
Expression of miR-155 and target proteins in CD69-deficient and -proficient Treg cells. (A, left) Representative histogram showing the levels of STAT5 phosphorylation determined by FACS analysis in sorted CD69+ or CD69− tTreg cells. (Right) Levels of STAT5 phosphorylation shown as fold differences compared with isotype control-treated cells. Lines link measurements of CD69+ and CD69− tTreg cells from the same mouse. (B) Representative Western blot showing the levels of STAT5 phosphorylation in tTreg cells sorted as described above for panel A. Phosphorylation levels are normalized to STAT5 and β-actin total protein levels. (C to E) qPCR analysis of the relative expression levels of Foxp3 (C), the BIC promoter, mmu-miR-155 (D), and socs-1 (E) in CD69+ and CD69− tTreg cells. Expression was normalized to the levels in CD69+ tTreg cells. (F) Representative Western blot of SOCS-1 protein expression in sorted CD69+ and CD69− Foxp3-mRFP+ tTreg cells. SOCS-1 levels are normalized to mean β-actin levels from of at least 4 independent sortings. (G, left) Representative histogram showing the levels of STAT5 phosphorylation in sorted tTreg cells from cd69+/+, cd69+/−, and cd69−/− Foxp3 reporter mice. (Right) Quantification of STAT5 phosphorylation levels shown as geometric mean fluorescence intensities. (H) mmu-miR-155 and socs-1 transcriptional levels analyzed by qPCR in tTreg cells from cd69+/+, cd69+/−, and cd69−/− Foxp3 reporter mice. All data are derived from at least 5 independent sortings/experiments (3 animals per sorting). For panels A to E, data were analyzed by a t test, except for Western blot analyses, for which representative gels are shown. Error bars show standard deviations. **, P < 0.01; ***, P < 0.001 (Student's t test). For panels G and H, data were analyzed by ANOVA followed by Bonferroni's multiple-comparison test. *, P < 0.05; **, P < 0.01; ***, P < 0.001.

