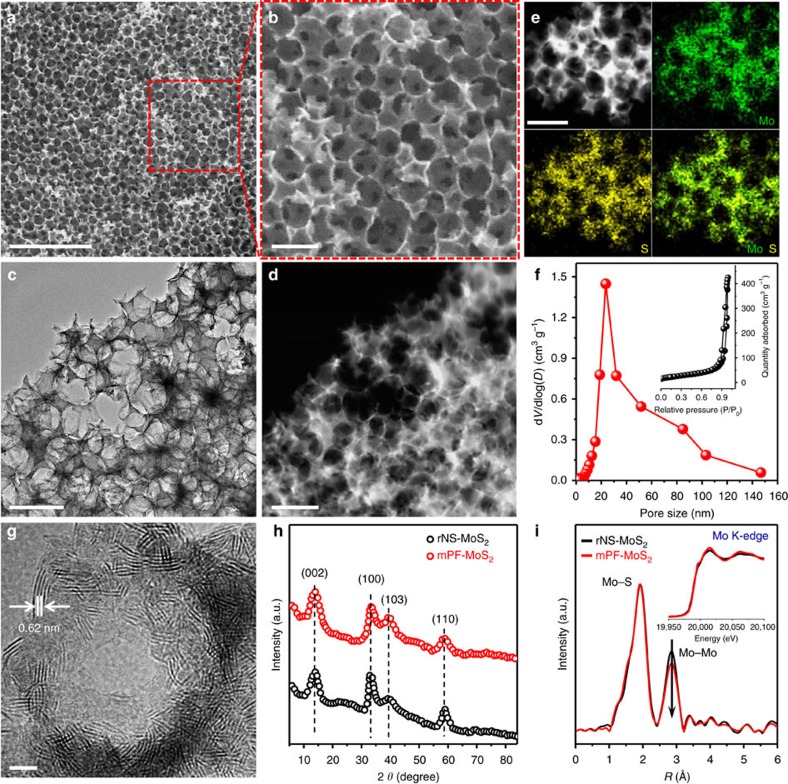
Figure 2. Morphology and structural characterizations of mesoporous MoS2 foam.
(a,b) SEM images of mPF-MoS2. (c,d) TEM image and corresponding HAADF-STEM image of mPF-MoS2 at the same position. (e) HAADF-STEM image and corresponding EDX maps of mPF-MoS2. (f) Pore size distribution and N2 adsorption–desorption type IV isotherms (inset) of mPF-MoS2. (g) HRTEM image of mPF-MoS2 with inset showing a typical MoS2 layer distance of 0.62 nm and a distinct mesopore. (h) XRD pattern of mPF-MoS2 in comparison to rNS-MoS2. (i) The k2-weighted EXAFS spectra of mPF-MoS2 in comparison with rNS-MoS2. The inset is the normalized Mo K-edge XANES spectra of mPF-MoS2 in comparison to rNS-MoS2. Scale bar: (a) 500 nm, (b–e) 100 nm, (g) 5 nm.

