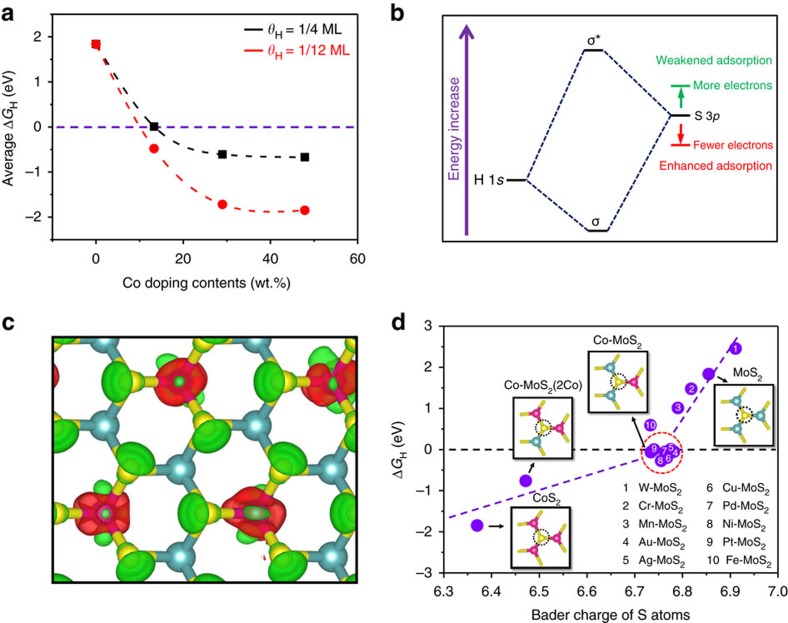
Figure 6. Theoretical calculations for the effect of Co doping contents on HER of MoS2.
(a) Average ΔGH on S atoms versus the Co doping contents, considering different coverage of 1/4 ML and 1/12 ML. The corresponding optimized catalyst structures can be seen in Supplementary Fig. 15. (b) Schematic diagram of the bonding of H 1s orbital and S 3p orbital (from MoS2), where depletion of electrons on S atoms will lower the orbital position and enhance the H–S bond. (c) Differential charge density of Co-doped MoS2 (Co doping content of 13.3 wt.%, Co:Mo atomic ratio of 1:2). Red and green contours represent electron accumulation and depletion, respectively. The isosurface level is set to be 0.11 e/Bohr3. (d) ΔGH on S atoms versus the Bader charge of S atoms for different structures, with the detailed data for each point shown in Supplementary Table 2. The insets are the atomic configurations of one S atom bonding with three Co, two Co and one Mo, one Co and two Mo, as well as three Mo atoms, respectively. Green balls: Mo; yellow balls: S; pink balls: Co.

