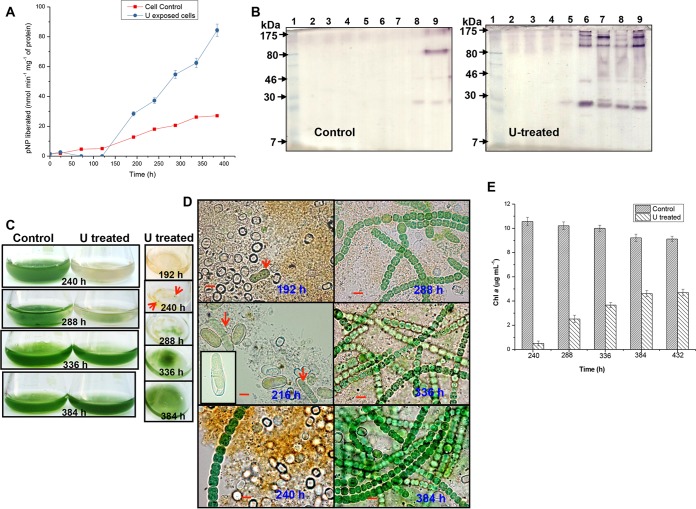
FIG 5.
Regeneration of A. torulosa following prolonged uranyl exposure. (A) Alkaline phosphatase (APase) activity and the corresponding zymogram (B) of control U-untreated cells or cells treated with 100 μM U at various time points during incubation for up to 384 h. The lanes in the zymogram (B) contained cell extracts from control U-untreated cells and U-treated cells at 0 h (lane 2), 24 h (lane 3), 72 h (lane 4), 120 h (lane 5), 192 h (lane 6), 240 h (lane 7), 288 h (lane 8), and 384 h (lane 9). Protein extracts (corresponding to 50 μg and 28 μg for control and U-treated cells, respectively, except for 19 μg in 288-h U-treated cells) were electrophoretically resolved by nonreducing SDS-PAGE along with prestained molecular mass standards (lane 1) and stained for in-gel phosphatase activity. (C) The flasks containing control U-unchallenged or U-challenged cultures demonstrating the regeneration following 384 h of uranium exposure. Also seen here is a top view of the flasks containing U-exposed cultures at definite intervals. Tiny green patches (marked by red arrows) heralding the regeneration were seen on the top of the experimental solution by 240 h of U exposure. (D) Bright-field microscopy (magnification, ×1,500; bars indicate 5 μm) of regenerating cultures corresponding to those shown in panel C. The germination of the akinetes is visualized by the elongation and division of the spore-like cells (192 h, indicated by red arrow) followed by the emergence of the germling (216 h, indicated by red arrows) comprising 2 to 3 vegetative cells (the inset in the image presents a closer view of the emerging germling). Images corresponding to 240 to 384 h of U exposure represent the progression of the regeneration of the cells. (E) Growth of control and regenerated A. torulosa cultures following uranium exposure is represented by chlorophyll a contents.

