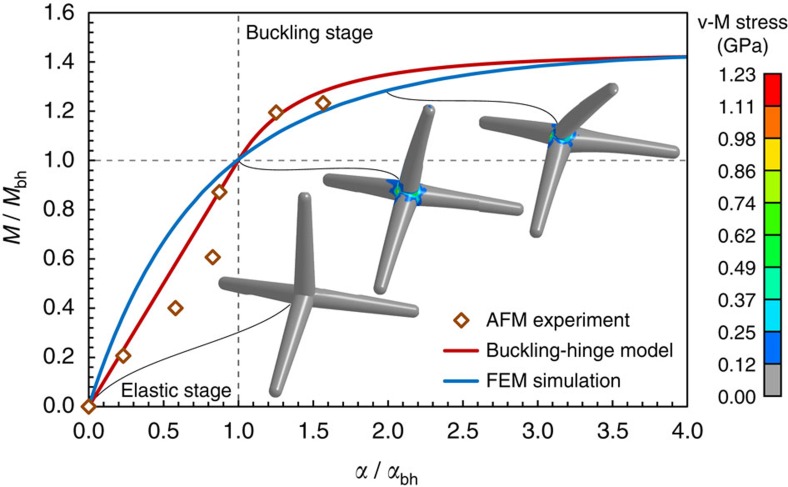
Figure 3. Normalized moment-rotation curve for bending of the tested single tetrapod.
Experimental results (dots), buckling-hinge model fitted on experimental data (red line) and FEM simulation (blue line) are reported. Contour plots of the von-Mises stress in the tetrapod outer layer of the wall is plotted (scale bar in GPa) showing the stress concentration at the central joint.

