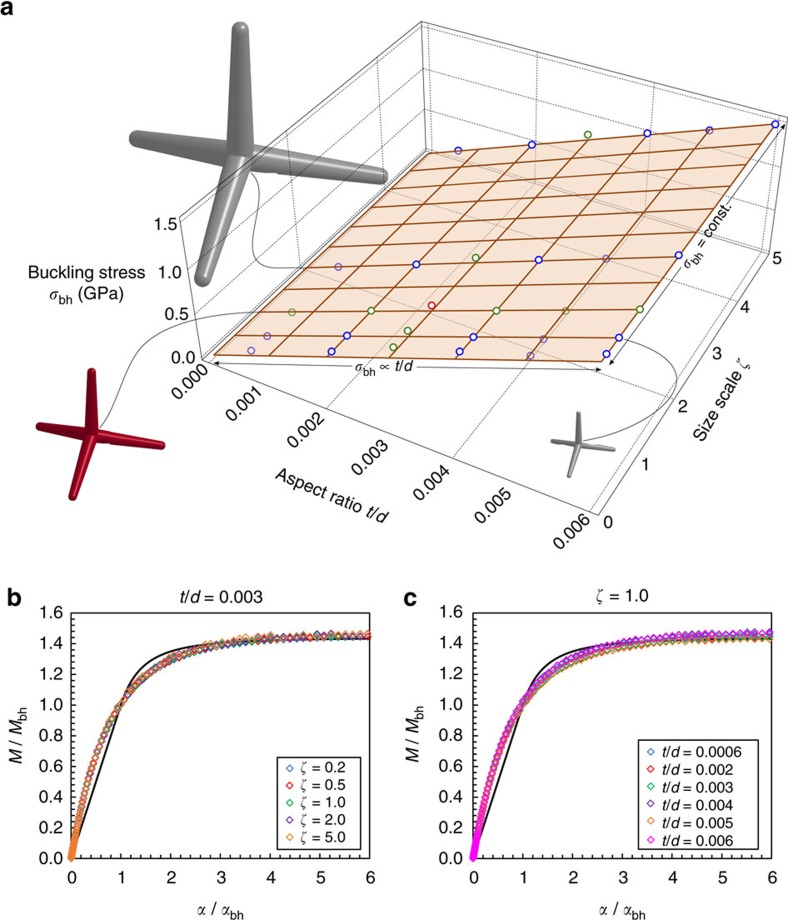
Figure 5. Scaling of the joint mechanical properties for different tetrapod size scales (ζ=d/d0=l/l0) and tube aspect ratios (t/d).
(a) Maximum buckling stress σbh=Eɛbh at the joint section from numerical simulations (dots) compared with the best-fit surface of equation (2). It emerges nearly independence of the buckling stress/strain from the size scale (t/d=const.) and linear dependence with respect to the aspect ratio t/d. The red dot represents the nominal tested tetrapod of Fig. 3 (ζ=1, t/d=0.003) while the green dots correspond to its size scaling with t/d=const.=0.003, or to the aspect ratio scaling only (ζ=1). Tetrapod at three different size scales (ζ=0.2, 1.0, 2.0) are depicted. (b) Dimensionless moment-rotation curves of the 5 performed simulations with t/d=const.=0.003 compared to the analytical prediction of the buckling-hinge model (continuous line). (c) Dimensionless moment-rotation curves of the 6 performed simulations with ζ=1 compared to the analytical prediction of the buckling-hinge model (continuous line).

