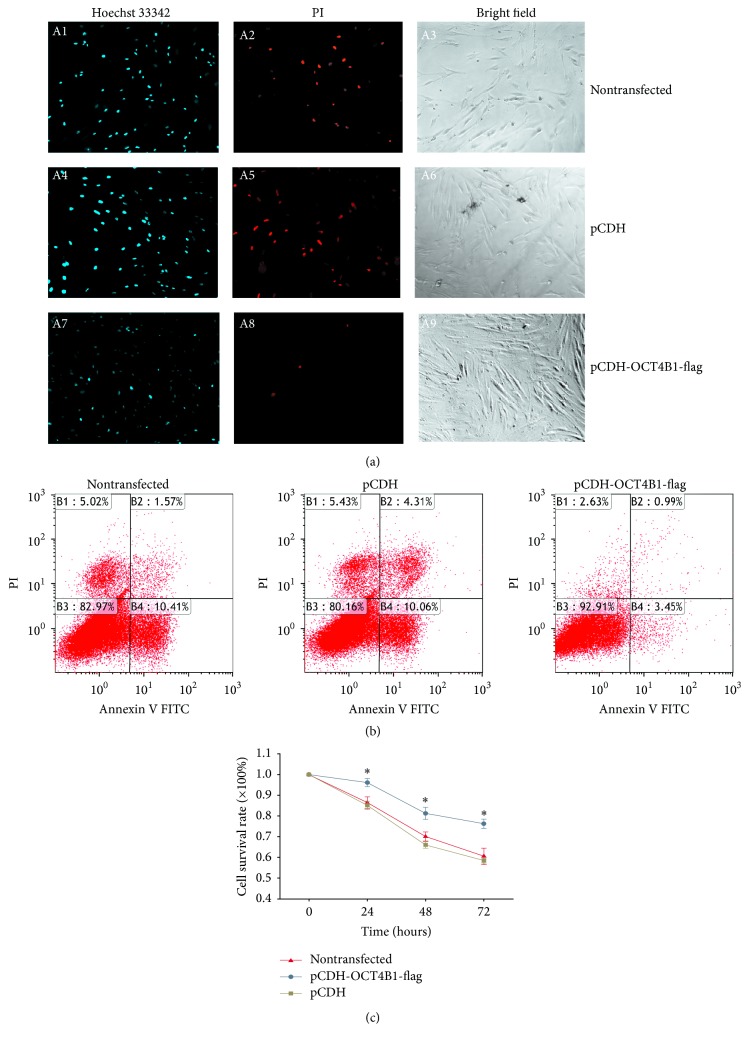
Figure 4.
Effect of OCT4B1 in DPCs with LPS induction. (a) The nontransfected, pCDH, and pCDH-OCT4B1-flag DPCs were treated with 100 ng/L LPS for 24 h and then stained with Hoechst 33342 and PI. Dark blue represented apoptotic cells and red fluorescence represented dead cells. The total cell number was observed under the bright field (×100). Cell number of apoptosis and death of pCDH-OCT4B1-flag cells (A7–A9) was remarkably lower than that of the nontransfected (A1–A3) and pCDH groups (A4–A6). (b) Cell apoptotic rate was examined by FACS. The percentage of apoptotic cells was decreased (3.45%) in DPCs with OCT4B1 overexpression compared with the nontransfected and pCDH DPCs (10.41% and 10.06%) (P < 0.05). (c) The line graph showed that, after being induced with LPS for 72 h, the survival rate of pCDH-OCT4B1-flag cells was significantly higher than nontransfected and pCDH DPCs (∗P < 0.05).

