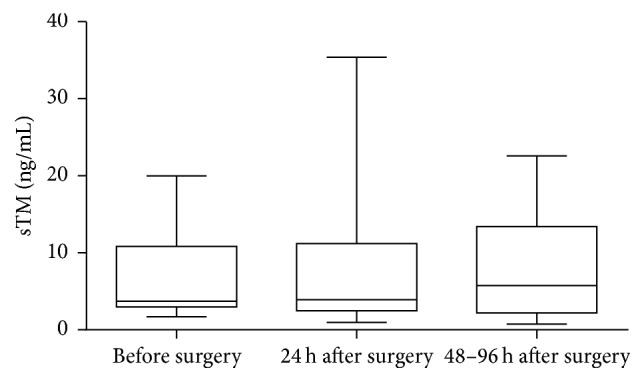
Figure 4.

Preoperative and postoperative concentration of sTM in AAA patients who underwent EVAR. Box and whisker plots show median (central line), upper and lower quartiles (box), and range excluding outliers (whiskers). Data were analyzed using Kruskal-Wallis test followed by Dunn's multiple comparison test.
