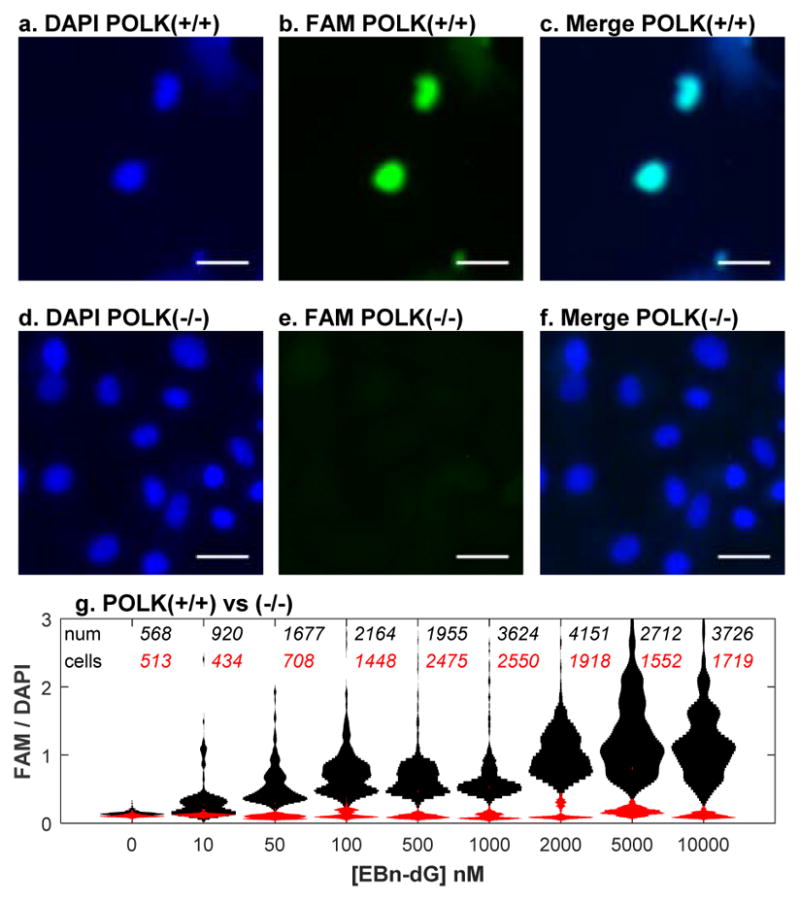
Figure 4.

Detection of EBdG in nucleus of pol κ containing cells. Wild-type (a–c) and POLK(−/−) (d–f) cells were treated with 10 μM EBdG for 24 h. DNA is visualized with DAPI-staining (a,d) and EBdG visualized by Click reaction with FAM-N3 (b,e). The white bar is 40 μm. g, Levels of FAM-EBdG conjugate in nuclei of MEF POLK(+/+) (black) and POLK(−/−) (red) cells. The incubation with EBdG was performed three times. The total number of cells in violin plots are described for wildtype (black) and POLK(−/−)(red) cells.
