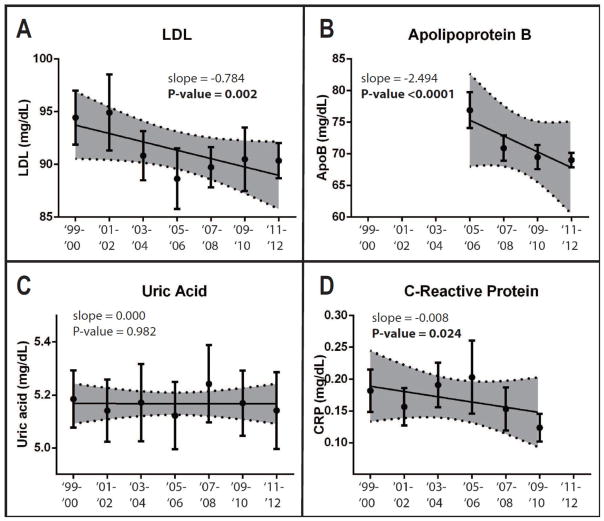
Figure 2. Metabolic health marker measurements show varying temporal trends from 1999–2012.
Individual means and 95% confidence interval bars are shown for each sampling period. Regression lines are shown with 95% confidence bands shaded. P-values are reported for non-zero trends. For prevalence values, slope is reported as change in percentage per sampling period. For measurements, slope is reported as change in measurement unit per sampling period. There were significant decreasing trends of low HDL and hypertriglyceridemia prevalence. There were significant decreasing trends in MetS Z-score and fasting plasma triglycerides. There were significant increasing trends in BMI Z-score and HDL.

