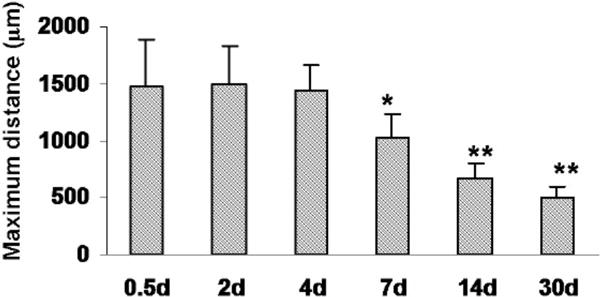
Fig. 4.

Progression of LC size changes following injury. Maximum horizontal distances of the area lacking NeuN staining were plotted at 0.5, 2, 4, 6, 14, and 30 days after photo injury. Means ± SD (n = 3 at each time point), ** P < 0.01, * P < 0.05 ANOVA and Dunnett’s test for multiple comparisons with 0.5 days.
