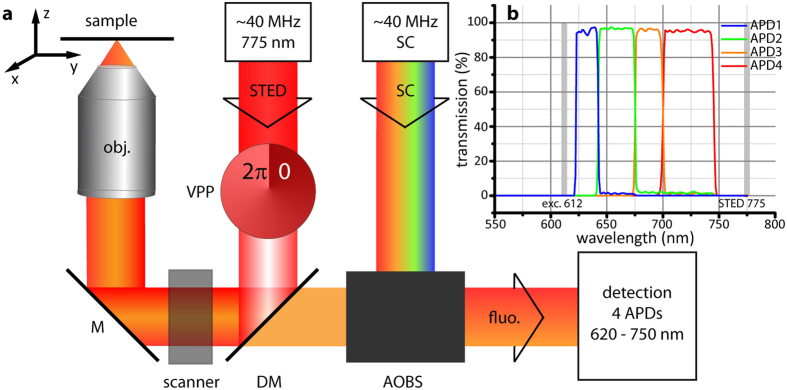
Figure 1. STED nanoscopy with hyperspectral detection (hyperSTED).
(a) Principle and main components. Different excitation wavelengths (here: up to 8) can be selected from the spectrum of a supercontinuum source (SC) by means of an acousto-optical beam splitter (AOBS). The excitation beam is overlayed with the STED beam at the dichroic mirror (DM). The doughnut-shaped focal STED light distribution for de-excitation is generated by a vortex phase plate (VPP). Both beams pass through a beam scanner and are focused into the sample by the objective (obj.). The fluorescence (fluo.) is recorded by a hyperspectral detection design spanning a total range of 620–750 nm in four channels. M: mirror. A more detailed layout of the optical arrangement is shown in Supplementary Fig. S1 (ref. 20). (b) Detection bands of the custom-built hyperspectral detector with avalanche photodiodes 1–4 (APD 1–4). Grey positions indicate wavelengths of excitation and STED de-excitation.

