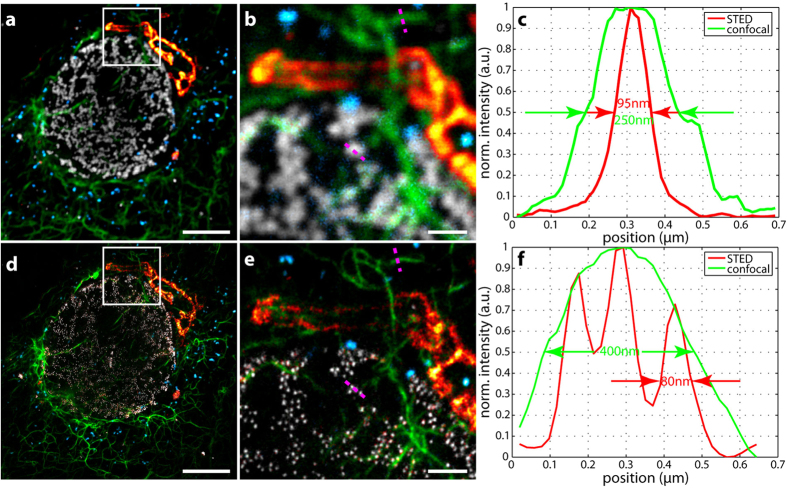
Figure 4. Four-colour hyperSTED data in a fixed cell (unmixed confocal and STED overlays).
(a) Confocal overlay. (d) STED overlay. (b,e) Enlarged views of regions in white squares, (b) confocal and (e) STED. (c,f) Line profiles along the magenta dotted lines indicated in (b,e) The data of (e) was drift corrected such that the maxima of the line profiles coincide. Proteins and fluorescent reporters: blue: peroxisomes – Atto594, green: vimentin – Abberior Star635P, red hot: giantin – KK1441, grey: nuclear pores – CF680R. Scale bars: 5 μm (a,d), 1 μm (b,e).

