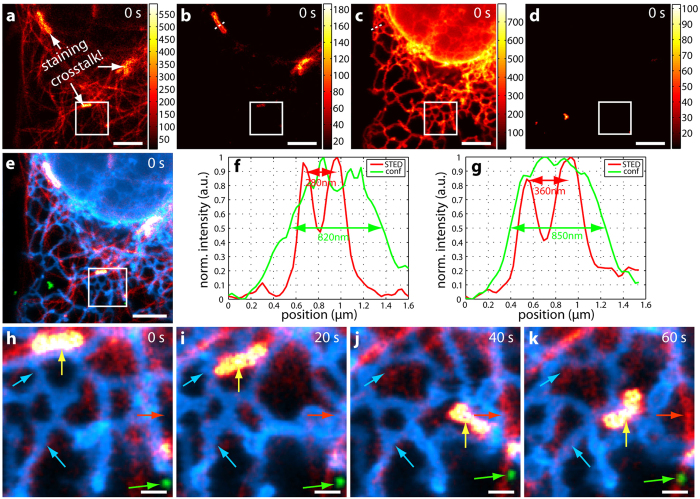
Figure 6. Four-colour live-cell hyperSTED data.
U2OS cells were stained with 580CP-docetaxel (tubulin), 620CP-Snap-OMP25 (outer mitochondrial membrane), SiR-Halo-Sec61β (ER) and CF680R-Tat-EGFP (endosomes). (a–d) Unmixed STED data for 580CP (a), 620CP (b), SiR (c) and CF680R (d) of the first of four consecutive frames. Note that only pixels above 10 counts are displayed. Data is counts registered (colourmaps indicated). There is clearly some crosstalk between (a) and (b) which is due to the staining process and not to the microscope (see text for more details). (e) Overlay of (a–d). Red: 580CP – tubulin, yellow: 620CP – mitochondria, blue: SiR – ER, green: CF680R – endosomes. (f,g) Line profiles along the white dotted lines in (b) and (c), respectively. The resolution enhancement due to STED (red lines) becomes clearly visible as the outer mitochondrial membrane is separated (f) and a more detailed structure is revealed for the ER (g) as compared to confocal imaging (green lines). (h–k) Time series of the region marked by the white square. Movements of all structures are observed, i.e. tubulin (red arrow), mitochondria (yellow arrow), ER (blue arrows) and endosomes (green arrow). Colourmaps are as in (e). Scale bars are 3 μm for (a–e) and 500 nm for (h–k). Excitation was at 612 nm with 5 μW and a STED power of around 60 mW at 775 nm.

