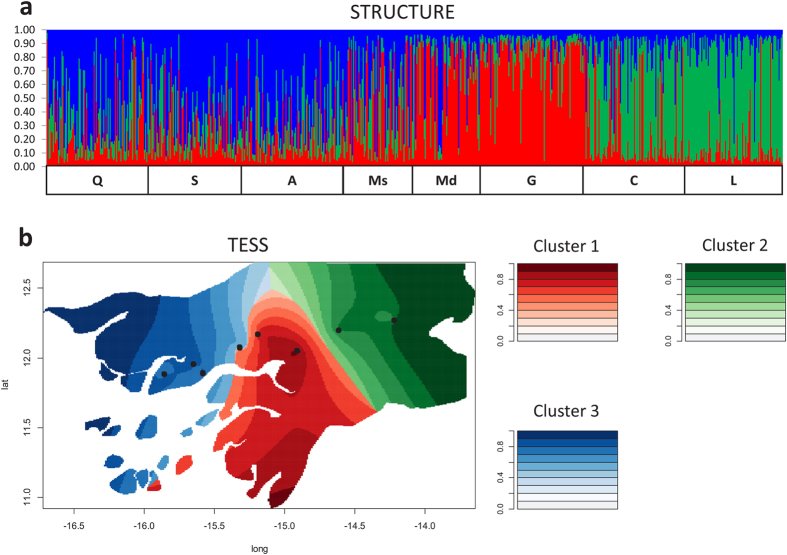
Figure 1. Microsatellite-based Bayesian clustering (STRUCTURE) and spatially explicit analysis (TESS).
(a) Graph of individual assignment probabilities of belonging to each of the three clusters detected by STRUCTURE. Red: cluster 1 (A. coluzzii), green: cluster 2 (A. gambiae-inland), blue: cluster 3 (A. gambiae-coast). The lower squares delimit mosquito samples according to collection site, from coast to inland (Q: Quinhamel, S: Safim, A: Antula, Ms: Mansoa, Md: Mandingará, G: Ga-Mbana, C: Comuda, L: Leibala). (b) Map of Guinea Bissau showing assignment probability densities for the optimal number of clusters obtained in TESS. The map was created by the R-script of software POPS version 1.262 (http://membres-timc.imag.fr/Olivier.Francois/pops.html). Black dots represent the localities sampled.

