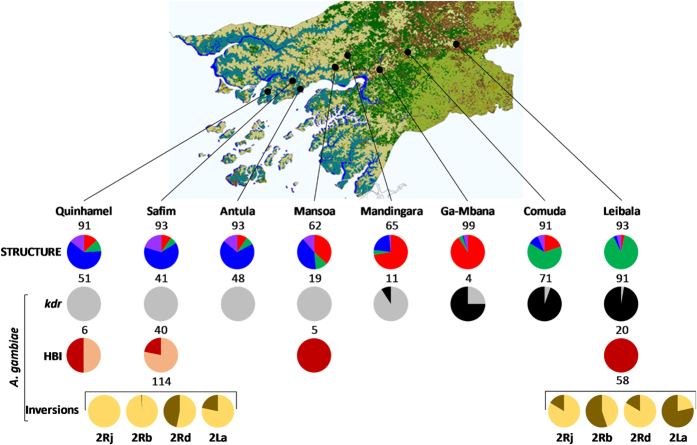
Figure 2. Map of localities surveyed showing microsatellite-based genetic cluster composition (STRUCTURE), and kdr frequency, human blood index and chromosome inversion frequency for Anopheles gambiae.
Map: GlobCover 2009 land cover map of Guinea Bissau. Copyright notice: © ESA 2010 and UCLouvain. Available at: http://www.fao.org/geonetwork/srv/en/metadata.show?id=37189&currTab=simple (Date of access: 27/11/2015). STRUCTURE: proportion of individuals assigned to each genetic cluster (assignment threshold Tq = 0.5). Red: cluster 1 (A. coluzzii), green: cluster 2 (A. gambiae-inland), blue: cluster 3 (A. gambiae-coast), purple: admixed. kdr: allele frequency of the knockdown resistance-associated 1014F allele (in black); HBI: human blood index (in red); inversions: frequency of the inverted arrangement in dark yellow at each of four inversions scored. Sample sizes are above each pie chart. Data on kdr, HBI and inversions are shown for A. gambiae only, identified by IGS/SINE at each site.

