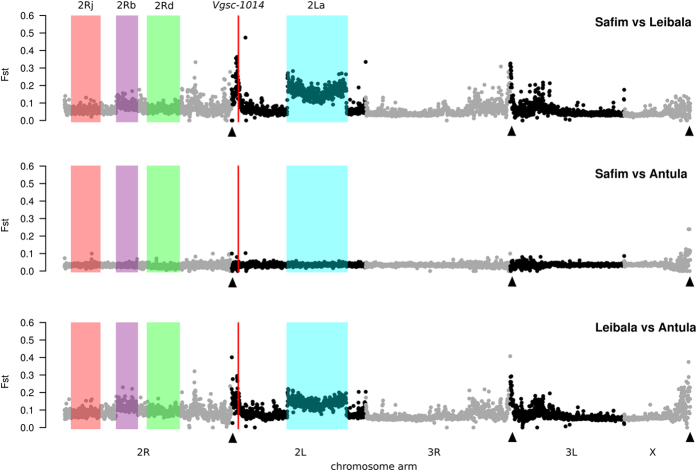
Figure 3. Manhattan plots of mean pairwise FST between Anopheles gambiae samples of Guinea Bissau.
Plots show the three pairwise comparisons of genome-wide differentiation between A. gambiae samples from Safim (coastal), Antula (coastal) and Leibala (inland). No A. coluzzii individuals were included in the analysis. Arrows indicate the location of the centromeres. The red vertical line indicates position 1014 of the voltage-gated sodium channel gene which corresponds to the kdr locus. The four inversion systems scored are also shown by the shaded areas. A 50 kb stepping window was used to generate the mean FST.

