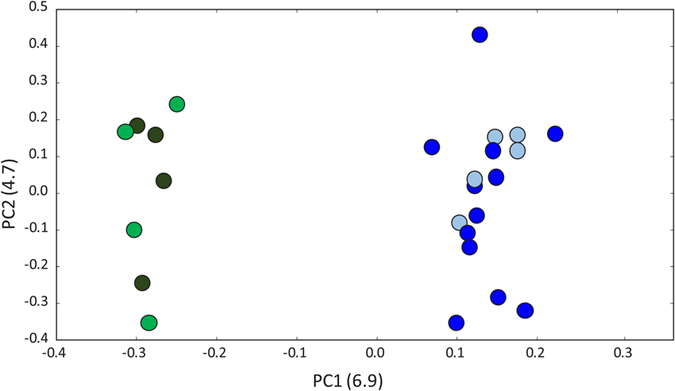
Figure 5. Principal Components Analysis based on chromosome arm 3L variants.

Dots represent the relationship between PC1 and PC2 of whole genome sequenced individuals collected in Antula (blue), Safim (light blue), Leibala (green) and Accra-Ghana (dark green).
