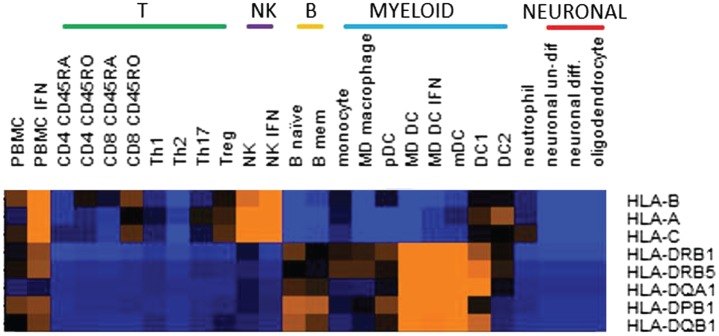
Figure 1.
Relative expression in cell subsets of the multiple sclerosis risk genes located in the major histocompatibility complex region. Expression was by RNASeq and color on heatmap indicates relative expression level: orange is high, blue is low. MHC risk genes are identified in Ref. (4). Cell subsets were ex vivo or in vitro generated as previously described (26).

