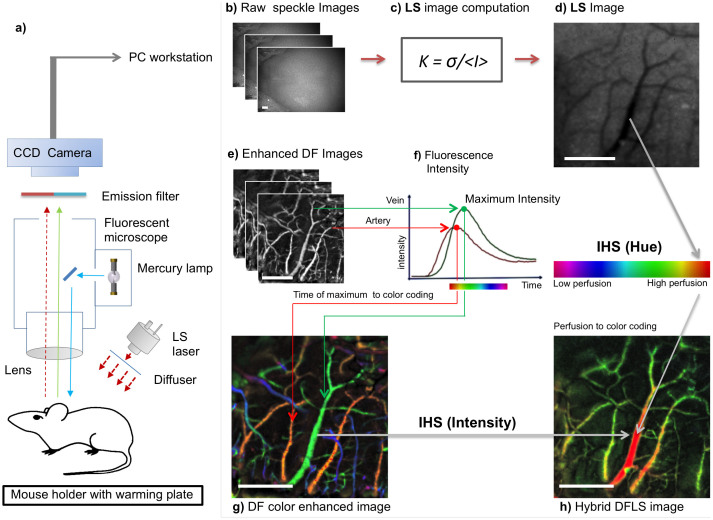
Figure 1. TOVI setup and principles of operation.
(a) Schematic of the imaging setup. The animal is placed under the lens on a special mouse holder with a warming plate, which maintains body temperature at 37°C. TOVI equipment includes a standard fluorescent zoom microscope, a lamp and an emission filter; the laser module is coupled with an optical diffuser. Images captured by a CCD camera are saved as a raw stacked 16-bit tiff files on a PC-based workstation. (b) Raw speckle images. (c) Computation of LS images. The mathematical formula K = σ/<I> is applied to calculated contrast in each pixel (see Methods). (d) LS image, In the processed image on the right, darker areas correlate with higher blood flow, corresponding with blood vessels (e) Enhanced fluorescent images are acquired by the same camera during a 10 second interval after fluorescent material administration. Following a noise elimination procedure (see Methods), for each pixel the frame (i.e. time point) of maximum intensity projection (MIP) is identified. (f) Graph shows florescence intensity as a function of time, illustrating the difference in arrival time between arteries (red) and veins (green). (g) DF color enhanced image, which is color-coded using the IHS, color model. Hue encodes time of maximal pixel intensity, whereas MIP is encoded as intensity and saturation. (h) Hybrid DFLS image. In the hybrid (DFLS) mode, data from both modalities are fused, as LS contrast level is encoded as hue and MIP levels from DF mode are encoded as intensity and saturation. (Drawing by V.K).

