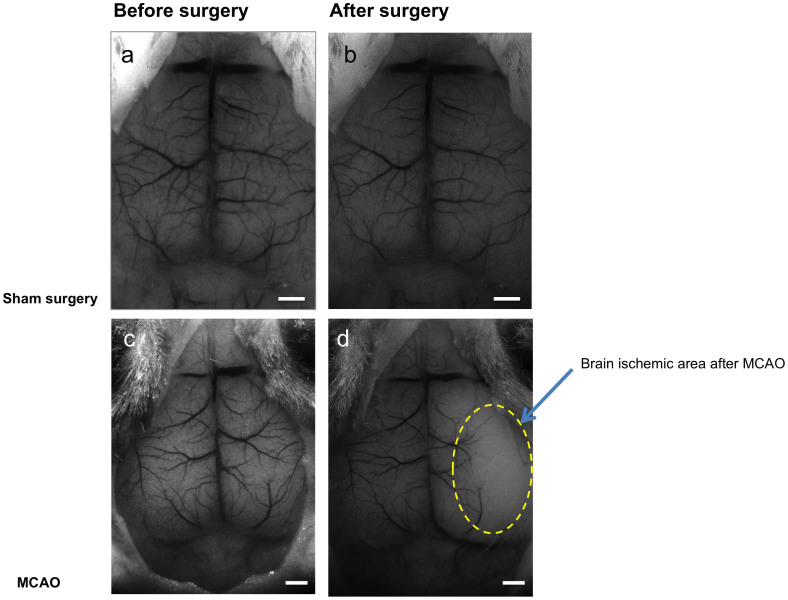
Figure 2. LS images of middle cerebral artery occlusion.
Images obtained by LS imaging show ischemic effect on cortical blood flow following MCAO surgery. (a,b) Images of a control mouse brain before (a) and after (b) sham surgery. (c,d) Images of a mouse brain before (c) and 10 minutes after (d) MCAO surgery. Yellow dashed line in d demarcates area of brain ischemia after MCAO. Scale bars, 1 mm.

