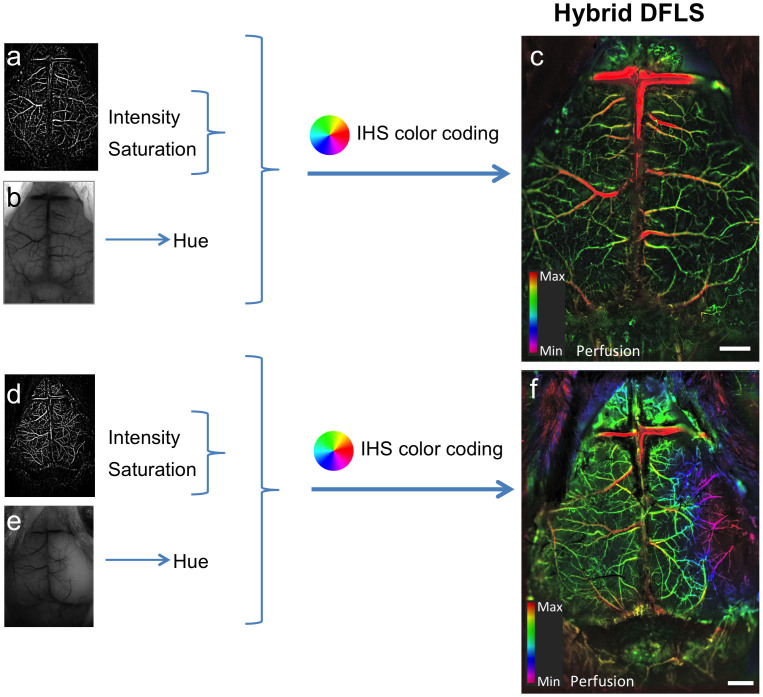
Figure 4. Visualization of hemodynamic changes during an acute ischemic event.
Color-enhanced hybrid images combining both LS and DF data show the effects of induced MCAO on a mouse brain. DF (MIP, a) and LS (b) images are merged and color-coded to create a hybrid image of cortical blood flow. (a–c) Images of the cortical vasculature of a control mouse. (d–f) Images of the cortical vasculature following occlusion; the lesion in the affected hemisphere is clearly visible in f (purple area on the right). Scale bars, 1 mm, color bars represents level of perfusion.

