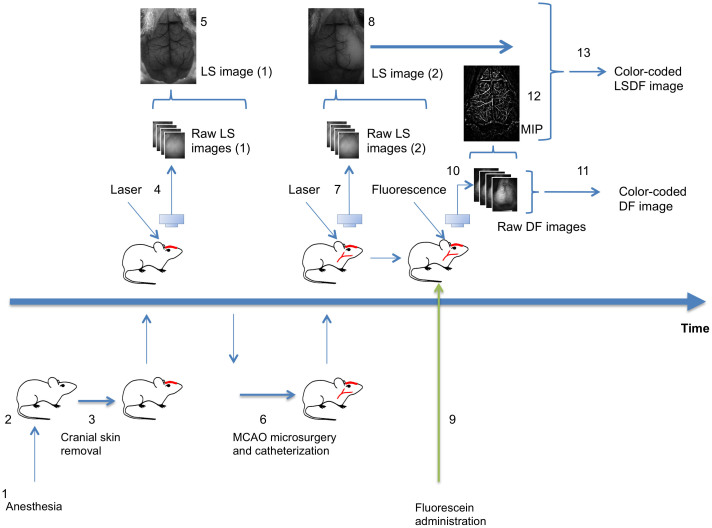
Figure 5. Workflow chart of visualization of MCAO procedure.
(1) Mouse is anesthetized (duration: 5 minutes). (2) Mouse is placed on a thermally controlled plate (2 minutes). (3) Cranial skin is removed (2 minutes). (4) Mouse is placed under the imager; 400 frames of raw LS images are acquired and saved. (5) LS image reconstruction using LS macro (10 second). (6) Mouse is moved to the surgical plate, MCAO and catheterization of tail vein are performed (30 minutes). (7) Mouse is placed under the imager; 400 frames of raw LS images are acquired and saved. (8) LS images are reconstructed (10 second) and analyzed (20 seconds) to determine successful occlusion. (9) Upon success of occlusion, fluorescein is administrated (2 seconds). (10) 400 frames of raw DF images are acquired and saved. (11) DF image reconstruction using DF macro (2 minutes). (12) Maximum intensity projection (MIP) image extracted from raw DF sequence (10 seconds). (13) LSDF image reconstruction using IHS code in ImageJ/Fiji (30 seconds). (Drawing by V.K).

