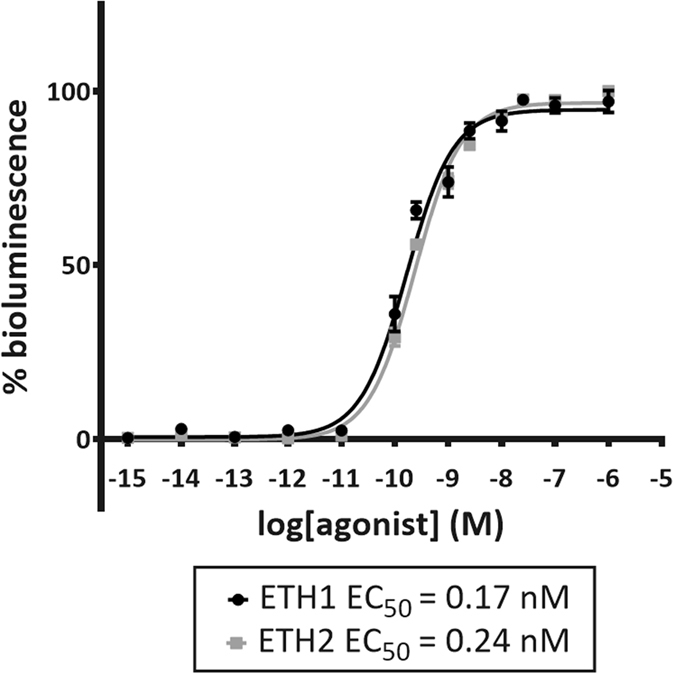
Figure 2. Dose-response curves for bioluminescence induced by SchgrETH1 and SchgrETH2 in SchgrETHR- expressing CHO-WTA11 cells.

CHO-WTA11 cells are stably co-expressing a promiscuous Gα16 subunit and apo-aequorin. Each data point represents the mean (±SEM) of two independent experiments performed in triplicate. Receptor activation is shown as relative (%) to the highest value (100%) after normalization to the maximum calcium response. All values were corrected for the negative control (BSA only).
