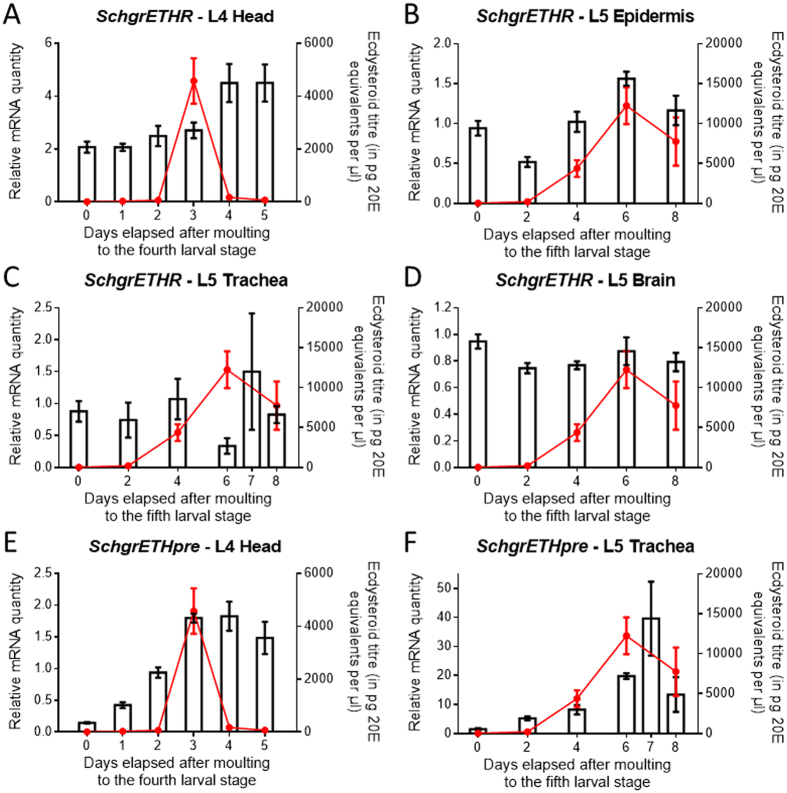
Figure 5. Temporal expression profile of SchgrETHR and SchgrETHpre as well as hemolymph ecdysteroid titres in fourth and fifth instar S. gregaria.
Using qRT-PCR, the relative transcript levels of SchgrETHR and SchgrETHpre (bars) were measured every day in the heads during fourth instar development and every other day in the trachea during fifth instar development. SchgrETHR transcript levels were also measured every other day in the epidermis and brain during fifth instar development. The data during fourth instar development represent mean ± S.E.M. of six independent pools of three animals, run in duplicate and normalized to RP49 and EF1α transcript levels. The data during fifth instar development represent mean ± S.E.M. of three independent pools of five animals, run in duplicate. The data in the epidermis were normalized to RP49 and EF1α, the data in the brain were normalized to GAPDH and CG13220, and the data in the trachea were normalized to α-tubulin1A, β-actin and EF1α transcript levels. Ecdysteroid titres (red line), expressed in pg 20E equivalents per μl hemolymph, throughout the fourth and fifth instar stage were measured with an EIA. The data represent mean ± S.E.M. of five pools of three hemolymph samples taken from different animals.

