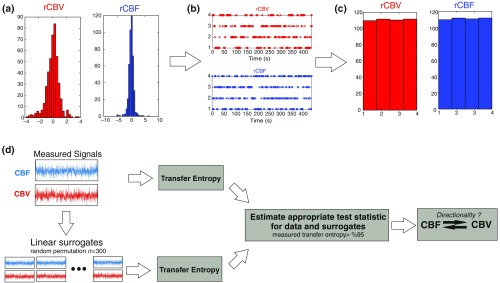
Fig. 2.
(a) Distribution histogram of rCBV and rCBF, (b) time-series of rCBV and rCBF expressed as quantized values to produce time-series with identical probability variables, (c) flat distribution of rCBV and rCBF, and (d) diagram of the surrogate data approach to the rCBF-rCBV coupling hypothesis.

