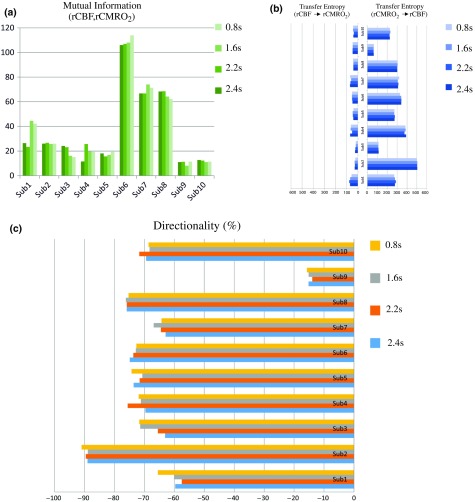
Fig. 7.
Impact of time-lagged rCBF on with different time lags (0.8 s, 1.6 s, 2.2 s, 2.4 s): (a) amount of information shared between rCBF and measured by MI, (b) TE indicates the amount of information exchanged from rCBF to and vice versa with different time lags, (c) DI indicates the dominant direction of the transfer, the negative sign indicates the dominance of over rCBF and vice versa.

