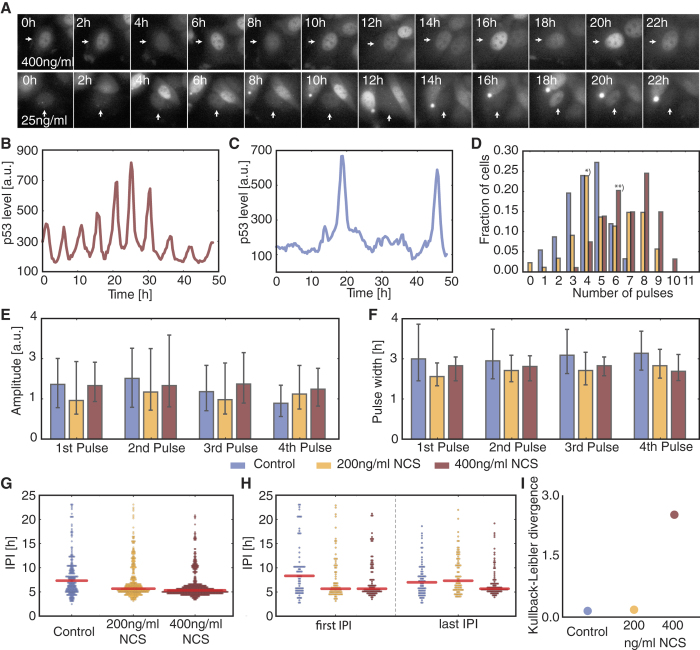
Figure 1. Analysis of p53 single cell trajectories.
(A) Time-lapse microscopy images of MCF7 cells expressing p53-Venus after stimulation with 400 ng/ml or 25 ng/ml NCS. (B,C) Trajectories of p53 protein levels in individual cells showing sustained oscillations (B, upper row in A) or isolated pulses (C, lower row in A). (D) Pulse counting statistics for three different experimental conditions as indicated in the legend below panels E, F. Cells were observed for 48 h. (E,F) Median amplitudes (E) and pulse width (F) of the first four p53 pulses, error bars indicate the 1st and 3rd quartile respectively. (G) Inter-pulse-interval (IPI) distributions for all three experimental conditions with samples taken over the entire observation time. Narrower distributions indicate more coherent pulsatile dynamics. (H) IPI distributions of the first and last recorded IPI respectively. The medium stimulated cells (yellow) already returned to irregular pulsatile dynamics at the end of the experiments, while the highly stimulated cells (brown) still show very coherent pulse trains. (I) Kullback-Leibler divergence (KLD) of the first control IPIs from the last IPIs for all three conditions. Dynamics of the medium stimulated cells are indistinguishable from the basal dynamics at later time points.

