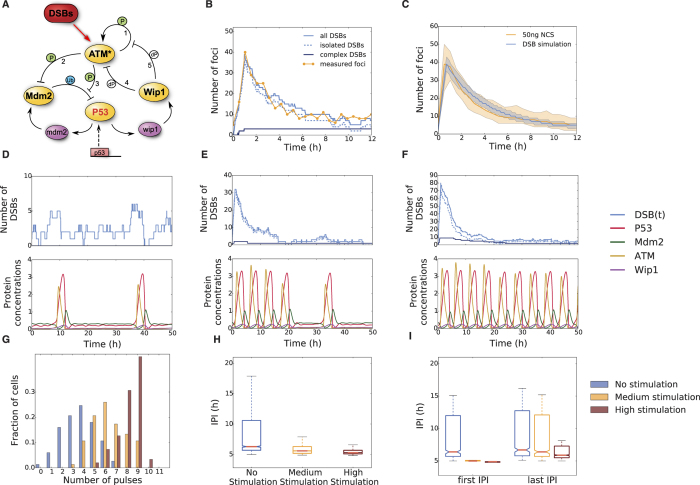
Figure 3. A p53 model driven by stochastic DSB processes recovers experimentally measured dynamical properties.
(A) Interaction graph of the modeled p53 network in response to DSBs. Modelled molecular interactions include phosphorylation (P), dephosphorylation (dP) and ubiquitination (Ub); mRNA species (mdm2 and wip1) are shown in purple, all other species describe proteins. The numbers refer to the explanations in the text. (B) A single exemplary realization of the stochastic DSB process. Shown are the dynamics of the two damage types (isolated and complex) and the total effective number of DSBs over time. For comparison, the measured number of DSBs over time post damage is shown for an individual cell (yellow). (C) Statistics of measured and simulated foci for populations of cells. Shown are the median and 1st and 3rd quartiles. N = 120 for simulations, N = 52 for measurements. (D–F) Exemplary DSB process realizations and the corresponding p53 model responses. Shown are three different stimulus intensities: control condition (D), medium stimulation (E) and high stimulation (F). (G) Pulse counting statistics for three simulated ensembles with stimulation strengths as indicated. (H) Inter-pulse-interval (IPI) distributions corresponding to the ensembles shown in G. The overall coherence of the pulsatile response increases with stimulation strengths. (I) First and last IPI distributions for the three different stimulation strengths corresponding to the simulated ensembles shown in G and H. The medium stimulated cells have mostly returned to unstimulated dynamics, whereas the highly stimulated cells still predominantly show coherent oscillations on the single cell level.

